
By: Zachary Harmer B.Sc.; SoilOptix Inc.
The SoilOptix® process from in field collection to a final data layer involves a standard four step process; from soil mapping, extraction of soil samples, data processing and finally retrieval of results. The figure below illustrates this four-step process where each is important to the resulting SoilOptix® high resolution soil data information. This article will look to explore these steps in further detail, using a unique example that produces actionable management decisions in field.
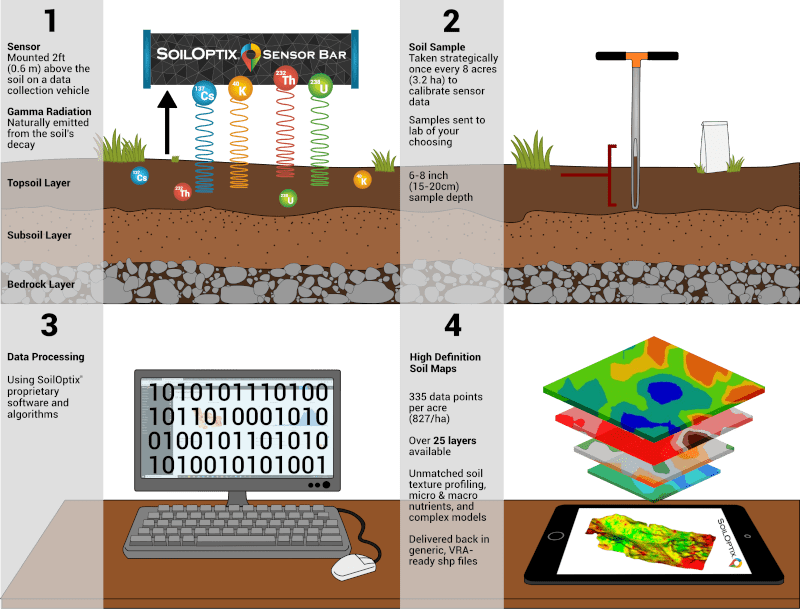
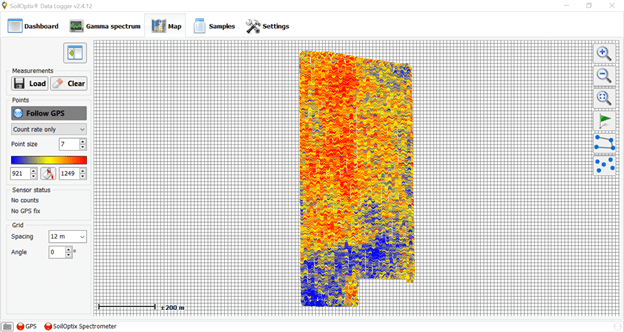
Step 1 of this process involves the use of the SoilOptix® sensor to map the gamma radiation across the field. The sensor, mounted 2ft (80cm) above the ground on a field survey vehicle, is used to survey and collect information emitted from the soil itself. SoilOptix® providers follow the general guidelines of 40ft (12m) swath widths and speeds up to 12mph (20kph). Upon completion of mapping the field, the user will receive a map representing Countrate immediately in the SoilOptix® Data Logging (SODL) software. Figure 2 illustrates a full field survey collected using the SoilOptix® sensor technology, as displayed in SODL.
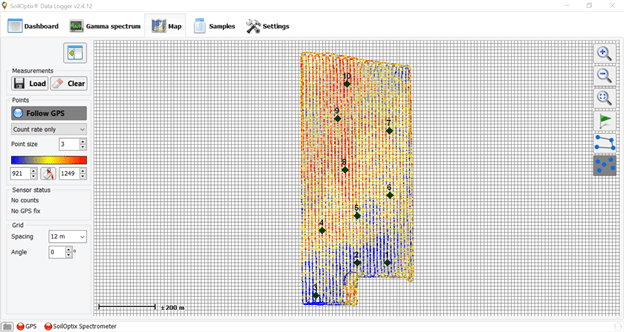
To produce results from SoilOptix®, physical soil samples are still required to be extracted from the field. Sample quantity per field are based on field size, stemming from a ratio of 1 sample per 8ac (3ha); where a minimum of 3 samples are required for fields less than 25ac (10ha). In this example, an 80ac (32ha) field was sampled where 10 soil samples were obtained (Figure 3). The location of these samples is important and as part of the SODL program a sampling suggestion tool is accessible for the user to identify the best location to sample the field. The suggestion tool emulates the operating procedure where samples should reflect areas of high radiation and low radiation, with the remaining samples spatially distributed with weighting towards covering the range in Countrate.
Upon completion of these two in-field steps the survey data and subsequent lab analysis results of the soil samples are submitted to SoilOptix® data analysis team for processing to be completed. SoilOptix® results are accessible for providers and growers through the SoilOptix® customer data portal, where fields can be visually assessed or download spatial files such as a shapefile or csv which can be loaded into GIS specific programs/platforms.
The resulting data from SoilOptix® can be used for multiple purposes including variable rate application of fertilizer or seed, precise management of water, or more informed practices around field scouting. In some instances, historical field management (or lack thereof) can influence the present-day decisions growers may make in their fields. In the example below, a Total Count and Uranium-238 map are shown. These two layers are specifically outputted as part of the SoilOptix® sensor technology and used as an input to models developed. As shown in these two layers, there is a unique line through the middle of the field that stretches North to South most of the way through which depicts a natural “border” to this area.
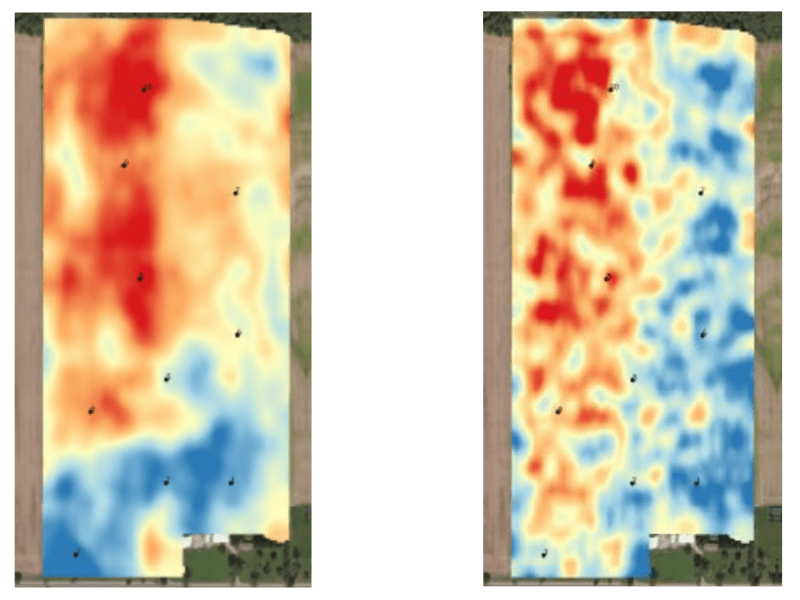
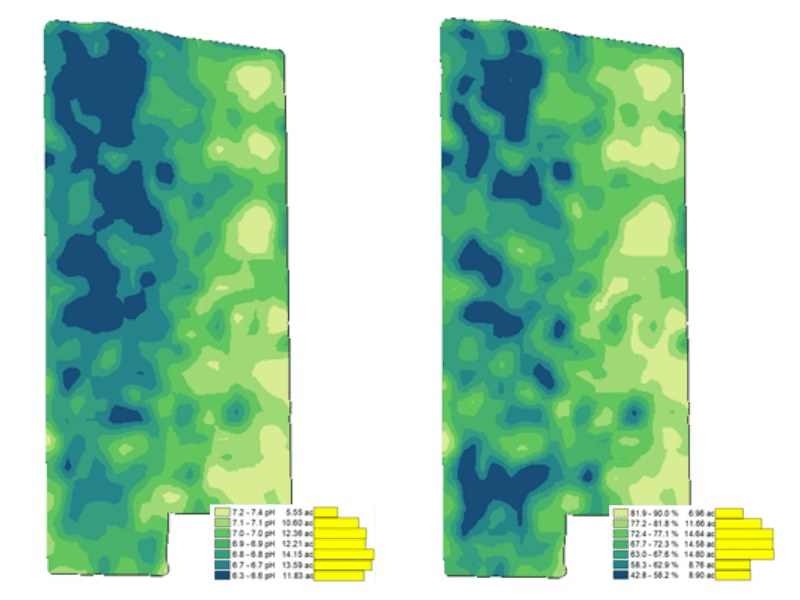
Resulting soil nutrient layers continued to show a similar trend, where the west and east side of the field continued to differ. Figure 5 illustrates soil pH and Calcium Base Saturation with the unique distinction between the west and east parts of the field. These unusual patterns initiated further investigation with the grower which resulted in a fascinating story regarding this fields history.
Historically, prior to the field being farmed as one, this field was split in two parts which followed the same line as the break the sensor picked up. Previously, the west side of the field had consistently been conventionally tilled with continuous crop however, on the east side had been used for pasture for quite some time. These historical differences likely have led to the varying differences between U-238 and Total Count in addition to their distinct patterns through varying soil properties such as soil pH.
Soil mapping technologies are a great way to delineate various spatial patterns, including historical influences such as this example. Gamma radiation mapping, as used with SoilOptix® sensor technology, has shown to be an indicator of these unique situations by relying on the stable/repeatable measurements acquired through data collection. Taking these findings through to management decisions is key to further identifying pockets of opportunities and addressing the bottom-line potential.