
By: Zachary Harmer B.Sc.; SoilOptix® Inc.
It is known that there is soil texture variation across space and utilizing soil sensors like SoilOptix® gamma radiation detector can assist in mapping and understanding where these changes occur. In-field representation of soil texture variation can be derived across different soil mapping technologies. In this example, the SoilOptix® count rate map is shown as seen in the SoilOptix® Data Logger (SODL). Count rate is defined as the number of counts collected by the spectrometer, divided by the measurement time. These counts are a representation of the gamma radiation emitted from the soil and measured by the spectrometer itself. In most soils, as this count rate increases (red below) soils become heavier in nature and generally contain more organic matter (OM). Vice versa, as the count rate decreases (blue below), soils typically are higher in sand content with lower OM.
This article will investigate 4 specific samples and the true soil environment as a function of the count rate delineation from the SODL map shown below.
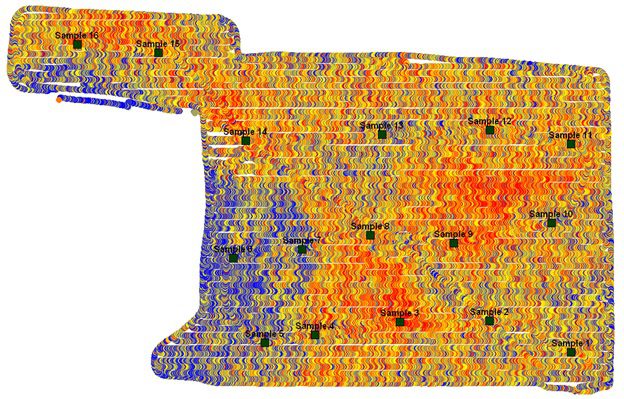
The above samples were extracted based off SoilOptix® standard operating procedure, where high and low count rate areas are sampled, while also ensuring remaining necessary samples are spatially distributed through the remainder of the field and across the spectrum of count rate data. For this study, we are focusing on 4 specific samples, each with varying count rate levels and resulting ground and soil conditions. Each location is exhibiting a difference amongst one another, while following the patterns of count rate versus soil texture.
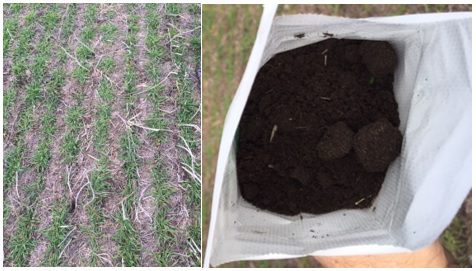
Sample 1 – Yellow (count rate: 550)
Sample 1 was in a yellow count rate area which was the “middle” levels for this field. In the picture’s below we can visually see some OK vegetation stand, with some darker soils and some organic matter.
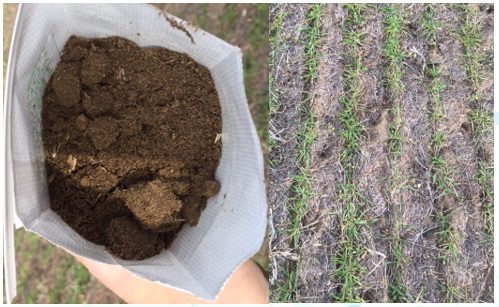
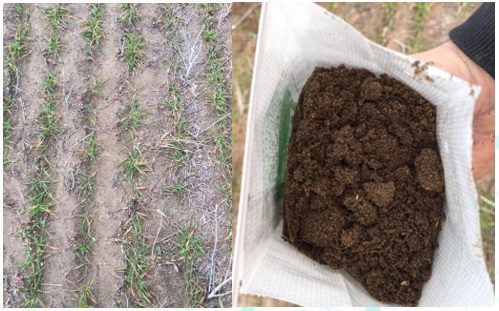
Sample 2 – Light Blue (count rate: 527)
In this Sample 2 area, the count rate was lower than Sample 1, and located in a “light blue” area. The soil in this area, as seen in the pictures, was more granular in nature with a reduction in the vegetation stand.
Sample 3 – Red (count rate: 621)
With a count rate above 600, this sample was in one of the highest count rate areas. This area as seen in the pictures below is much darker and heavier in nature. In addition, the crop just below in this area is much thicker, nearly filling the row spacing completely.
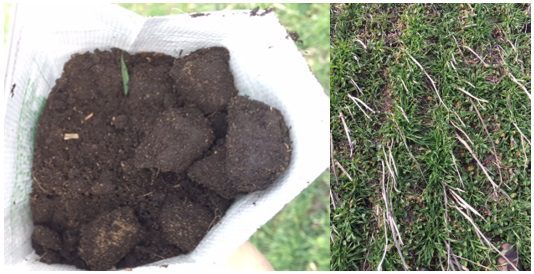
Sample 5 – Dark Blue (count rate: 524)
Sample 5 was taken from the lowest count rate area (dark blue). This soil typically is sandier, which is quite prevalent in the photos below. We can see in the soil bag itself, the soil is much lighter, while the vegetation is quite sparse and little organic matter is observed.
The previous examples illustrate the inherent relationships between soil texture variability and gamma radiation. Count rate, as a general indicator of soil variability can be used as an indicator to drive various management decisions when creating zone boundaries. To further extend the use of the layer, soil samples should be obtained to build specific Clay, Sand and Silt layers.