
The Results from VRT Seeding Script for Corn
- By: Steve Redmond; BSc
When we embarked on this Case Study, our goal was to determine if an experienced Precision Ag Specialist could develop Variable Rate Seeding prescriptions for corn using the Plant-Available-Water layer produced by SoilOptix® as a base layer. It’s our pleasure to introduce Cory Weber as the Precision Ag Specialist who wanted to take this journey with two of his customers, and we are thrilled to share the successful results they had!
Bio:
Cory has a career path in precision agriculture that began with his employment at John Deere Corporate followed by Premier Equipment Ltd, where he gained valuable experience and skills working equipment and John Deere Operations Centre. One year was spent working with Precision Ag Specialists at Deveron in Ontario, Canada, beginning his focus on agronomy and data. He is now employed with a mid-western Ontario agricultural cooperative where he and a small team of like-minded crop specialists are forging ahead with key farmers on various variable rate applications for crop production.
Note: A prerequisite for understanding this report is to read and understand the principles and background that is laid out in Variable Rate Seeding Using Plant Available Water Layer Pt. 1
NW Field – Post Harvest Analysis and Results
As-Applied Seeding Rate:
Figure 1 is the As-Applied Seeding Rate for the corn crop planted on the NW Field in 2024. The map shows that the areas of the field with the lowest Plant Available Water (see VR Seeding Case Study Part 1) have been seeded at a plant population of 33,600 – 34,700 seeds/acre, while the areas of the field with a higher level of Plant Available Water were seeded at rates of up to 38,600 seeds/acre.
The “As-Applied” planting maps show how the corn planter, and associated controllers, were able to plant the required plant populations and test blocks. Test blocks were scattered throughout the field to validate the final yield and the decision-making process.
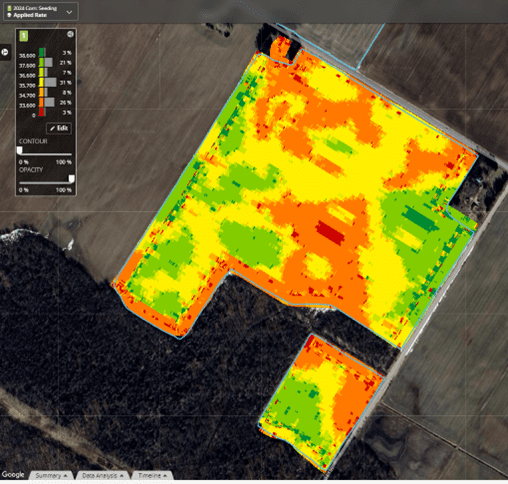
Figure 1: VRT Seeding As-Applied Map for NW Field
Post-Harvest Analysis
Did the upper and lower seeding rates for the hybrids used on the field fall within an acceptable range for the 2024 growing season?
The average yield for the NW Field was determined to be 231.65 bushels per acre. This “field-average” yield is outstanding for Midwestern Ontario, where the provincial corn average provided by Agricorp[1] for the 2023 growing season was 190 – 210 bushels/acre for most of this region, and 210 – 240 bushels/acre for the very best soils in the region. The incidence of the leaf disease Tar Spot (Rhytisma acerinum) had a very large detrimental effect on corn yields in 2024. Reports of yield losses of 20 – 80 bushels/acre from Tar Spot were common in Ontario in the 2024 growing season[2]
Appendix 1 shows the rainfall records for the 2024 growing season. Appendix 2 shows the Agronomy Notes for the NW Field.
2024 Adjusted Yields for NW Field
Figure 2 is the 2024 corn yield after careful processing of the yield data to clean-up the raw data.
The overall average yield for this 83.5-acre field was 231.65 bushels per acre. Zone 1 and Zone 3 were approximately the same size, while Zone 2 was slightly larger and contributed a greater amount to the overall yield of the field. Please see the table of results below for details of each zone
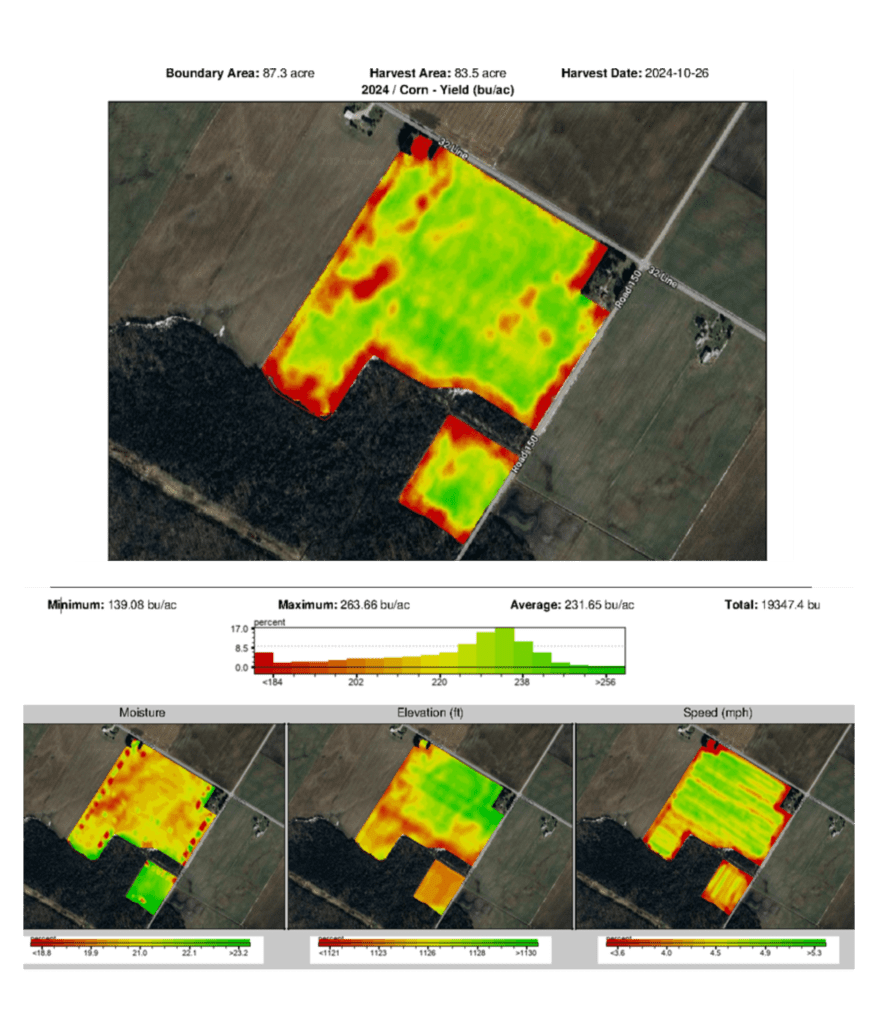
Figure 2: Yield Analysis of the NW Field
Plant Available Water for NW Field
Figure 3 is the Plant Available Water layer used to develop the VRT Seeding script. The areas in RED have lower than average Plant Available Water and it is in these areas where the Precision Ag Specialist chose to reduce the plant population and therefore reduce the cost of seed.
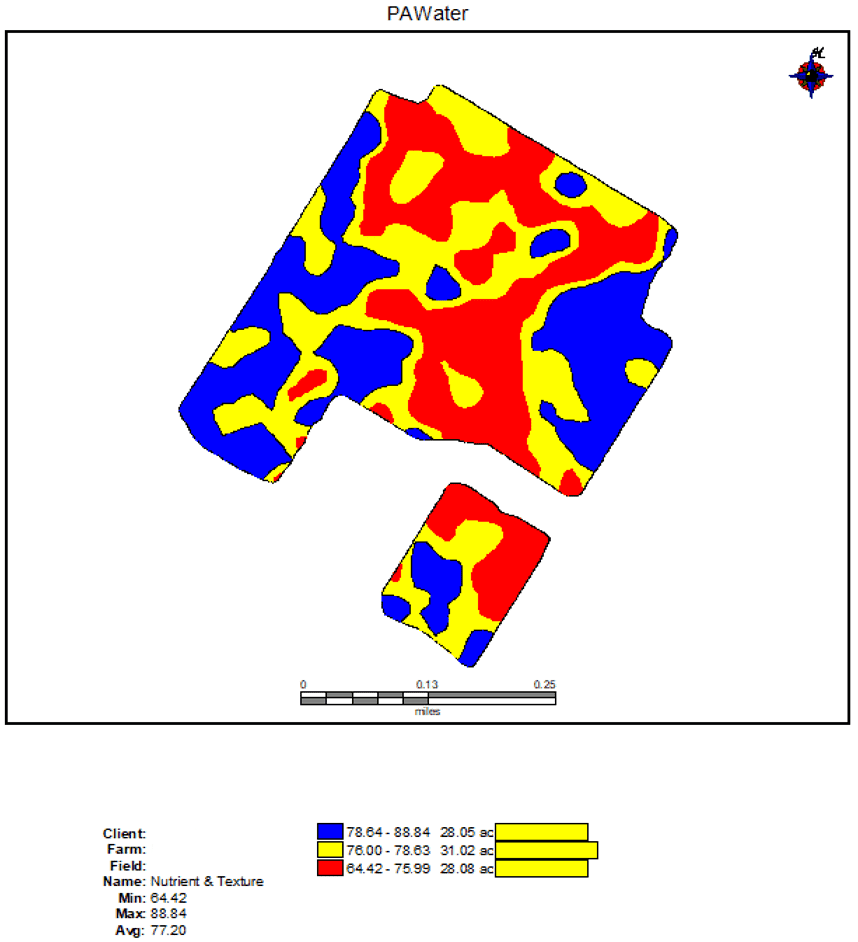
Figure 3: SoilOptix® Plant Available Water layer map
Yield Summary for Seeding Rate Changes on the NW Field:
| Zone | Yield (bushels/acre) | Plant Population with Highest Profit/Acre [3] |
| 1 – Test Block [4] | 234.33 | 34,000 |
| 1 – average for zone | 216.47 | 34,000 |
| 2 – Test Block | 234.45 | 34,200 |
| 2 – average for zone | 226.13 | 36,000 |
| 3 – Test Block | 240.82 | 39,900 [5] |
| 3 – average for zone | 217.21 | 38,800 |
Discussion for NW Field:
The results from the NW Field are encouraging. The use of the Plant Available Water Layer by the Precision Ag Specialist, Cory Weber, appeared to provide an accurate delineation of the crop management zones where plant populations could be increased or decreased to increase the profitability of the field. The author suggests that the optimum growing conditions and high crop management of this field resulted in a response to higher populations on this field. If lower than normal rainfall – and therefore Plant Available Water – was received during the growing season, the yield and subsequent profitability of lower plant populations may have been different.
The grower has stated that, with recognition of the optimal rainfall and temperatures during the growing season, the yields were higher than they have ever experienced on this field. They plan to continue with VRT corn seeding using the zone creation system utilized by their Precision Ag Specialist, Cory Weber, and continue refining the methodology for zone creation.
SR Field – Post Harvest Analysis and Results
As-Applied Planting Map for SR Field
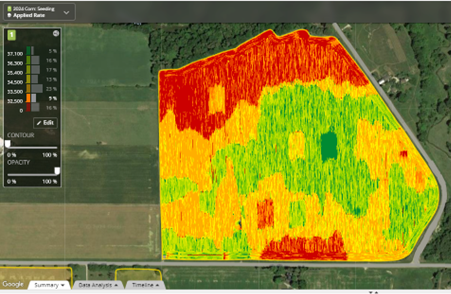
Figure 4: As-Applied Seeding Map for SR Field
The Precision Ag Specialist, Cory Weber, and the farmer have taken a more conservative approach on the SR Field.
Figure 4 is the As-Applied Seeding Rate for the corn crop planted on the SR Field in 2024. The map shows that the areas of the field with the lowest plant available water (see Figure 5) have been seeded at a plant population of 32,500 – 33,500 seeds per acre, while the areas of the field with a higher level of plant available water are seeded at rates of 36,300 – 37,100 seeds per acre.
Test blocks were planted in each of the three zones to provide a level of scrutiny to the chosen populations. A test block of 30,400 was planted in Zone 1 (lowest Plant Available Water) and a test block of 37,800 was planted in Zone 3 (highest Plant Available Water).
Plant Available Water for SR Field
Figure 5 is the Plant Available Water layer used to develop the VRT Seeding script. The areas in RED have lower than average Plant Available Water and it’s in these areas where the Precision Ag Specialist chose to reduce the plant population and therefore reduce the cost of seed.
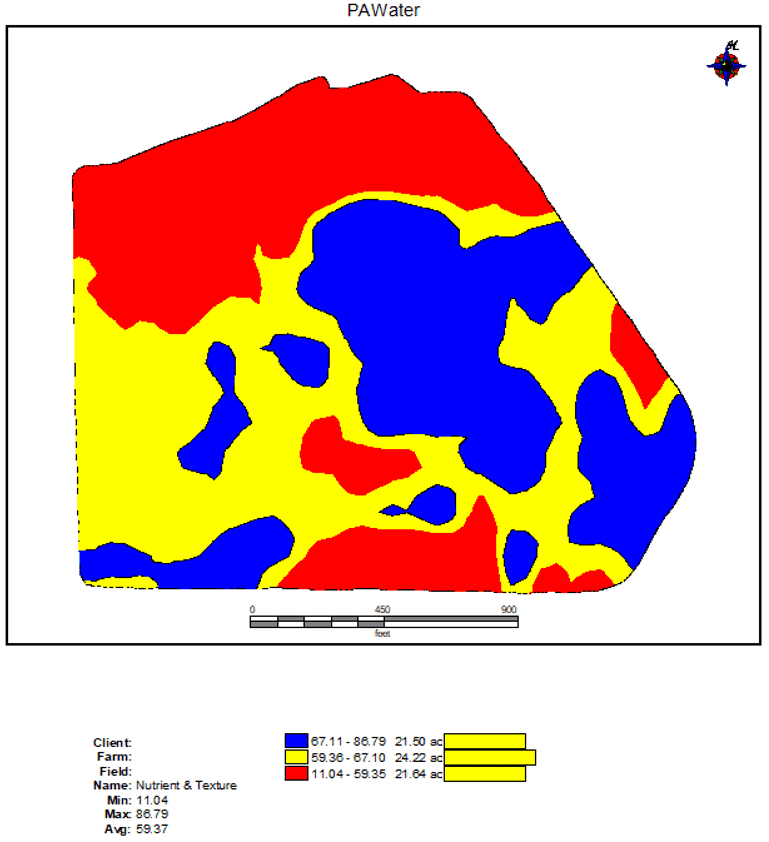
Figure 5: SoilOptix® Plant Available Water layer map for SR Field
Post-Harvest Analysis for the SR Field
Figure 6 is the 2024 corn yield after careful processing of the yield data to clean-up the raw data. The overall average yield for the 67.98-acre SR Field was determined to be 256.83 bushels per acre. Zone 1 was approximately 15 acres in size, Zone 2 and Zone 3 were approximately 24 acres in size. Test Blocks were 0.5 to 0.6 acres in size.
Appendix 1 shows the rainfall records for the 2024 growing season. Appendix 2 shows the Agronomy Notes for the SR Field. Again, we reiterate that the 2024 growing season was somewhat of an anomaly and the incidence of the leaf disease Tar Spot (Rhytisma acerinum) had a very large detrimental effect on corn yields. Reports of yield losses of 20 – 80 bushels/acre from Tar Spot were common in Ontario in the 2024 growing season.
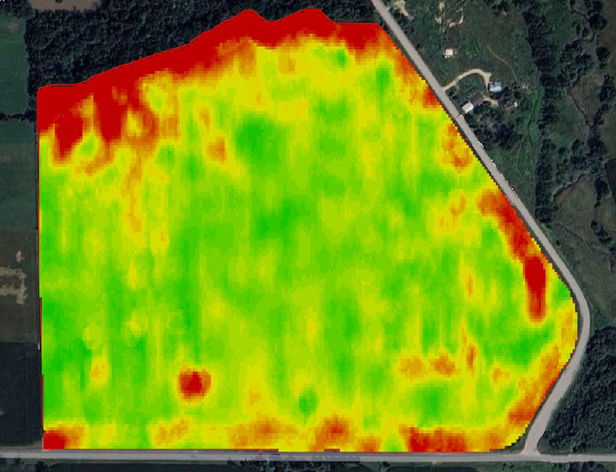
Figure 6: Processed Yield Map for SR Field
Yield Summary for Seeding Rate Changes:
| Zone | Yield (bushels/acre) | Plant Population (seeds/acre) |
| 1 – Test Blocks | 231 – 242 | 32,000 – 33,600 |
| 1 | 236.94 | 32,000 |
| 2 – Test Blocks | 259 – 264 | 34,000 – 35,700 |
| 2 | 261.2 | 34,000 |
| 3 – Test Blocks | 266 – 272 | 34,200 – 37,800 |
| 3 | 265.41 | 36,000 |
Discussion for SR Field:
The use of the Plant Available Water Layer by the Precision Ag Specialist, Cory Weber, on the SR Field once again appeared to provide an accurate delineation of the crop management zones where plant populations could be increased or decreased to increase the overall yield. It is noted that the Test Blocks for this field appear to verify that the populations for the three zones were accurate. A full profitability analysis may be helpful if a Precision Ag Specialist and Farmer want to dive deeper.
Overall Conclusions:
We are very satisfied with the results obtained on the NW Field and SR Field using the Plant Available Water layer for the development of variable rate seeding prescriptions for growing corn. Experienced Precision Ag Specialists can have a high level of confidence that the soil characteristics used to develop the Plant Available Water layer do in fact provide a good framework to measure soil productivity, and that this layer can be used with normalized yield maps and high level crop management to assist farmers with increasing the overall profitability of a field.
Weather Data for 2024 Growing Season
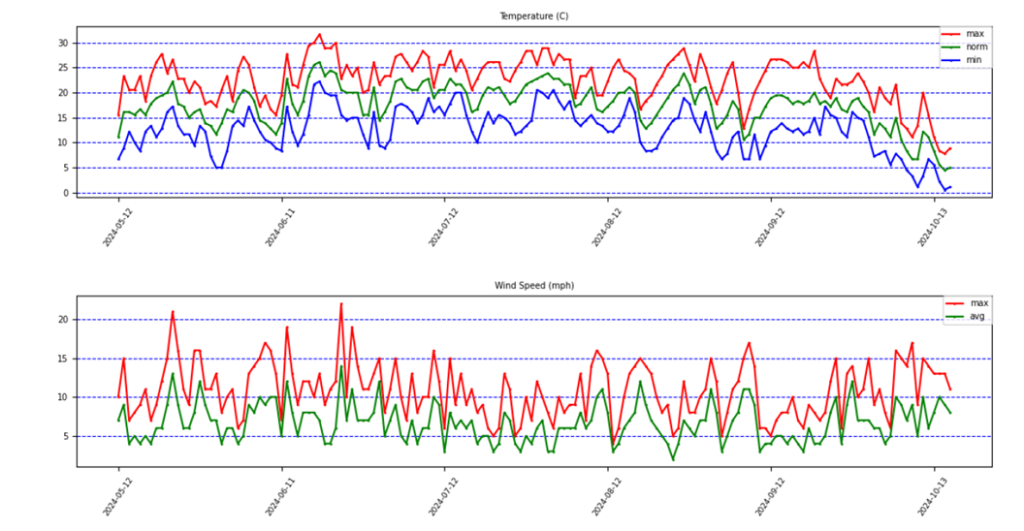
Figure 7: Weather Data for 2024 Growing Season
Appendix 1
2024 Growing Season Precipitation Totals in Ontario (mm):
https://climate-change.canada.ca/climate-data/#/monthly-climate-summaries
| Month | London, ON | Mount Forest, ON | Kitchener, ON |
| May | 99.9 | 86.5 | 102.1 |
| June | 133.7 | 30.8 | 81.5 |
| July | 154.9 | 158.3 | 149.1 |
| August | 74.8 | 58.7 | 103.5 |
Appendix 2
Agronomy Notes for NW Field
| Soil Texture | Clay Loam |
| Average Organic Matter | 4.3 % |
| Phosphorus (sodium bicarbonate) | 20 ppm |
| Potassium (ammonium acetate) | 114 ppm |
| 2023 Crop | Winter Wheat |
| Primary Tillage | Fall Disk, Spring Cultivator |
| Preplant/Broadcast Fertilizer | 120-60-55-13S |
| Starter Fertilizer | 4 US gallon/acre of 5-18-3-2S liquid |
| Side-Dress N | 66 lbs N/acre (22 US gal/acre UAN) |
| Nitrogen Application Method | Y-Drop Applicators (In-season between rows) |
| Fungicide Application | VT Stage Timing |
| 2024 Leaf Diseases | Tar Spot epidemic |
Agronomy Notes for SR Field
| Soil Texture | Silt Loam |
| Average Organic Matter | 2.5 % |
| Phosphorus (sodium bicarbonate) | 8.6 ppm |
| Potassium (ammonium acetate) | 87 ppm |
| 2023 Crop | Winter Wheat |
| Primary Tillage | Fall high speed disk, Spring strip-tillage |
| Preplant/Broadcast Fertilizer | 15-0-0-32S (applied with strip tillage) |
| Starter Fertilizer | 5.5 US gallon/acre of 6-24-6 liquid |
| Side-Dress N | Y-Drop 60 lbs of N/acreY-Drop 60 lbs N/acre at V10 Stage |
| Nitrogen Application Method | Y-Drop Applicators (In-season between rows) |
| Fungicide Application | VT Stage Timing |
| 2024 Leaf Diseases | Tar Spot epidemic |
Footnotes
[1] https://www.agricorp.com/en-ca/News/2024/Pages/High-2023-corn-and-soybean-yields-shown-in-maps.aspx
[2] https://farmtario.com/crops/tar-spot-continues-on-the-move-in-ontario-corn
[3] Profit per acre calculated from gross revenue less cost of seed per acre.
[4] The yield in the three Test Blocks in Zone 1 were higher than the average for the zone. Critical analysis of each zone, including the placement of the Test Blocks is essential before conclusions can be made about the overall efficiency of the seeding rate.
[5] The Revenue, and subsequent Profit per Acre of a population of 39,900 seeds/acre was created on a test block approximately 0.36 acres in size. Care must be taken when making conclusions with this seeding rate.
About The Author
Steve Redmond; BSc
Steve Redmond has 35+ years of agricultural experience including crop protection roles in R&D and technical support, seed sales, environmental/nutrient management, soil sampling and fertility recommendations. His experience with Wintex soil samplers, an Aeryon Scout drone, GreenSeeker/Y-Drop applicators and NDVI imagery, VRT seeding and fungicide applications prepared him to enthusiastically embrace the SoilOptix® sensor technology. Now semi-retired, Steve continues to work on projects of interest including “SoilOptix® Agronomy”, balanced nutrition for culinary farms and Irish history.
Connect with Steve: