
By: Steve Redmond; BSc
Introduction
With the advent of SoilOptix®, we now have a tool to better understand and manage the “chaos” resulting from glacial activity that formed the soils we are farming today. A basic understanding of how the bulldozing activity of the glaciers and the subsequent ponding into large lakes as the glaciers retreated may help the crop consultant or agronomist understand the variability of macronutrients such as potassium, magnesium, and calcium and why we need to balance these important soil nutrients. For the author, gamma radiation mapping and developing layers of each soil nutrient has enabled VRT applications of potassium and magnesium that have helped to balance these important cations and improve the yield and quality of crops grown in these soils.
Glaciation of Soils in Ontario
During the Pleistocene epoch, all of Ontario was covered by a succession of ice sheets. There were two and probably four invasions of ice, each separated by interglacial periods lasting for many thousands of years. It has been estimated that Southern Ontario has been free of glacial ice for about 10,000 years.
As the glacial ice advanced, presumably it rode over hills and low mountains. In eastern Canada, areas with elevations of 5,000 – 6,000 feet show evidence of glaciation. Remains of previous glaciations were reworked; hills were smoothed and reshaped; new valleys were gouged out and old valleys filled with glacial debris. As the ice moved, loose material was picked up, pieces of bedrock were pulled away, and the whole mass was ground up.
The Landscapes of Southwestern Ontario
In SW Ontario, the resulting landscape was made-up of well drained and undulating-to-rolling clay loam materials. The ice mass planed and ground the bedrock over which it moved and when the quantity of pulverized material (till) became too large to be moved with the glacier, it was dropped and overridden by the ice. This action tended to mold the till into the topographic forms that exist today. When the glacier acted as a bulldozer and pushed the till ahead of it, a type of “recessional moraine” resulted.
Reference: Origin, Classification and Use of ONTARIO SOILS, Publication 51
Understanding the basics of how soils were formed helps one to understand why there are clay knolls (and often eroded-clay-knolls), depressional areas with “better dirt” and deposits of high calcium, high magnesium, high sand content, and other soil nutrients.
Magnesium, Potassium and Calcium – Cations that must be Balanced
In SW Ontario it is critical to understand the primary function of soil nutrients like; Magnesium, Calcium and Potassium, and how imbalances in these important soil nutrients can result in both lower yield and poor quality of crops.
There are many references that describe the role of cations and other soil nutrients. Anyone interested in advanced knowledge of BCSR must read “Mineral Nutrition of Higher Plants’ by Horst Marschner.
Base-Cation Saturation Ratio (BCSR)
The BCSR is a method of interpreting soil analysis results that has been widely used by independent soils labs and innovative agronomists for almost 50 years. In 1981, Baker and Amacher redefined the earlier work on the ideal ratio as 60-80% Ca, 10-20% Mg and 2-5% K. A decade later Neal Kinsey co-wrote a book with Charles Walters called “Hands on Agronomy” in which the ideal ratio was defined as 60-70% Ca, 10-20% Mg, 3-5% K.
Note: Hands on Agronomy is a fabulous read for anyone trying to understand soil variability and the historical mistrust farmers have of soil sampling and soil analysis results.
As an Agronomist, I was taught the importance of BCSR in a Soil Fertility Workshop in 2006 and as I began to analyze soil samples with this understanding of potential imbalances, it became fundamental to my work in the soils of SW Ontario.
In fact, I quickly discovered that the fertilizer industry had placed too much emphasis on Phosphorus and high rates of Nitrogen and the result were soils that were very imbalanced in their K:Mag ratio.
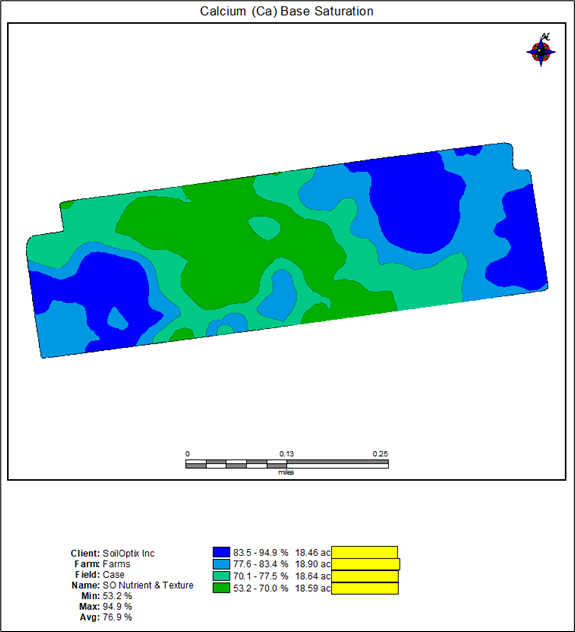
In the area were most of my work was happening, north of London, Ontario, the soils are high in Calcium (>80% BCSR).
Value of the SoilOptix® System
The academic side of understanding BCSR was (and is) simply “academic” until you have a method of visualizing the variability of the bulldozer effect of the glacial action. Each field or farm is unique as the estimated 3-4 km of ice working its way across an individual farm was quite random and the glacier simply did not understand that in the future, we would carve up the landscape into rectangular shapes and attempt to grow food on soils that were unbelievably variable. (I’m not sure that the glaciers really understood what they were doing so I apologize if I have offended any geologists).
As an Agronomist, when I experienced the SoilOptix® technology for the first time, I knew immediately that we had found the Holy Grail for soil analysis and that we could now help farmers to manage soils at a resolution never before possible, or imaginable!
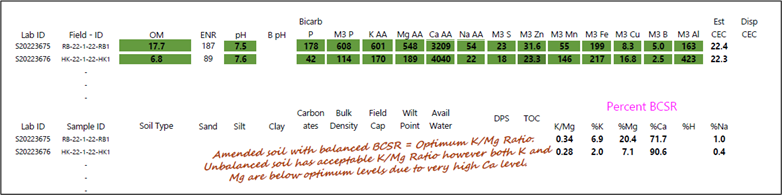
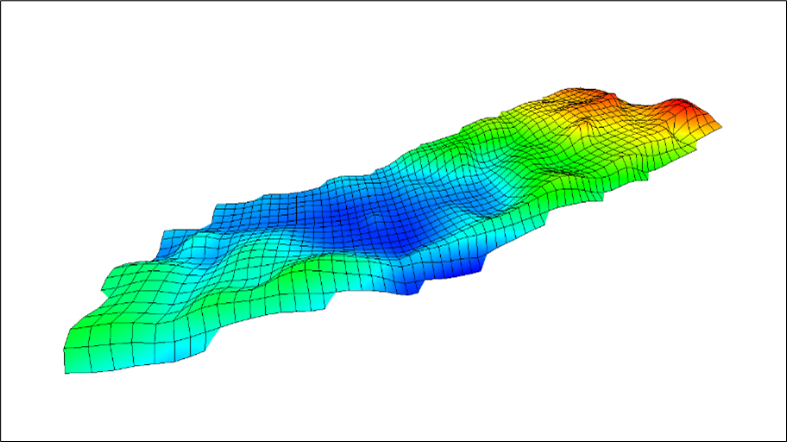
Case Study – Hardy Farm
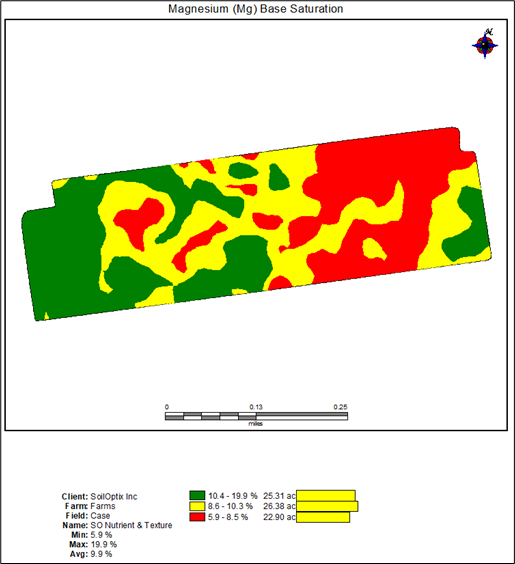
The Case Study which we will call the “Hardy Farm” is a wonderful example of not only potassium and magnesium imbalances but also of the glacial effect on a single field. The glacial effect is evident in the SoilOptix® elevation layer captured by the accurate GPS used in conjunction with the gamma radiation sensor. The glacier left an elevated area of calcareous soils that is typical of the area. Prior to the widespread adoption of reduced tillage and no-till systems for soybeans and winter wheat, these elevated areas were highly eroded, low in productivity and many of the ‘eroded knolls’ continue to have calcium levels that range from 85-90%. Obviously, this does not allow 10-15% Mg and 3-5% K to balance these important cations.
Although most of these soils are low in Magnesium (<10% BCSR) there are also areas of high Mg (> 20-25% BCSR). These higher “Mag” soils typically are very low in potassium (<2% K). Since K is required in large amounts and is critical to osmotic potential of cells, these soils have poor drought tolerance and at critical periods such as pollination and grain fill, they are at risk of significant yield loss. In a future Case Study, we will explore high magnesium soils (>20% Mg) and how they can be managed for improved internal drainage through amendment with gypsum (calcium sulfate dihydrate).
Another complicating factor in many fields is the manure history. The Hardy Farm has received regular applications of Sow-Weaner manure, and this has resulted in optimum P levels but less than optimal K levels. Swine manure from sow-weaner or SEW Sow facilities has similar amounts of phosphate and potassium, however the crop removal of potassium in a corn-soybean-winter wheat rotation creates an imbalance of soil nutrients between potassium and phosphorus, especially with increasing yields and the removal of the winter wheat residue as a form of extra income from the wheat crop.
Amending the Hardy Farm to Correct the Potassium and Magnesium Imbalance
There are two VRT applications that are required to attempt to bring the K and Mg into a “better balance”.
- Magnesium- using the % Mg BCSR layer and applications of KMag1
- Potassium- using the K ppm layer
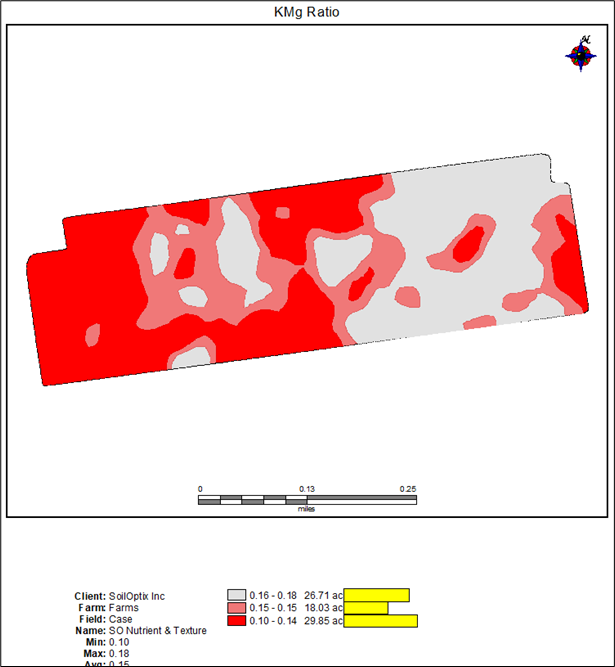
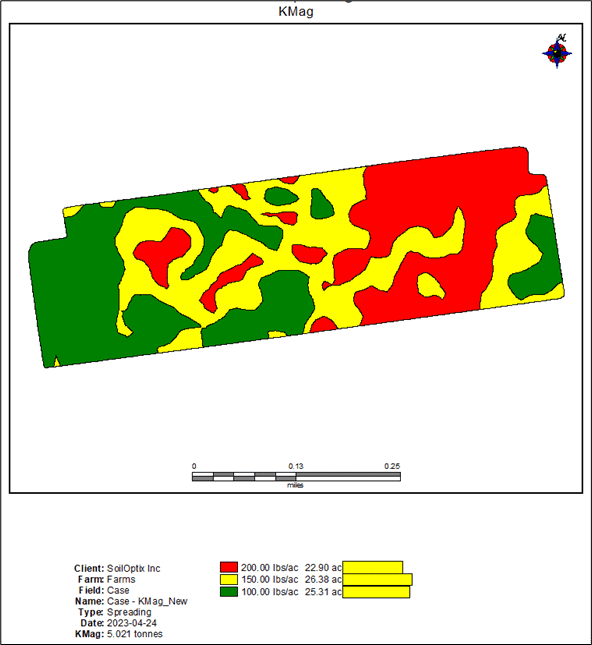
Magnesium:
We will use the % Mg BCSR2 layer and create 3 zones using “equal counts”. The lowest %Mg zone will receive an application of 200 lbs/acre of KMag. This level is greater than the crop magnesium removal rate for a 200 bu/acre corn crop and will allow a slight “build” on the Mg level on the high Ca areas. The middle zone will receive 150 lbs/ac of KMag3 and the zone with the “best” % Mg BCSR will receive 100 lbs/acre4. This rate provides 11 lbs/acre of magnesium, is slightly less than crop removal rate of magnesium, however this rate is easy to understand when starting out with VRT applications.
The benefit of KMag (0-0-22-11Mg-23S) is that it provides 22% potassium and therefore provides an amendment for imbalances in K as well Mg.
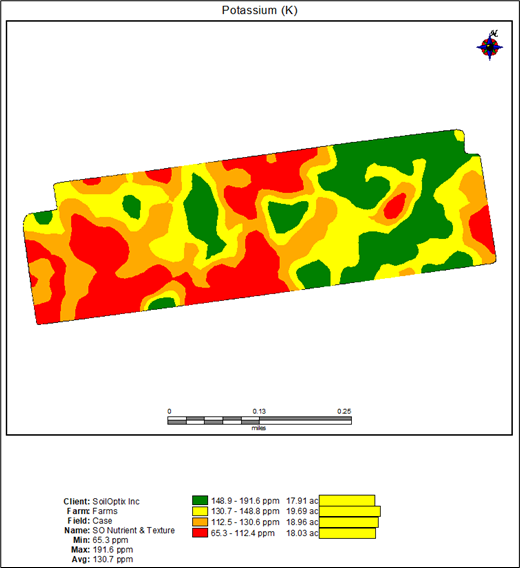
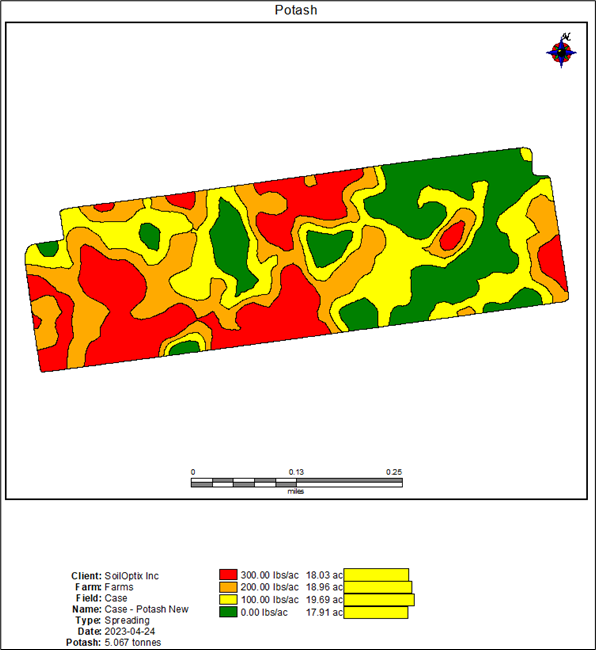
Potassium:
Building potassium is the number one objective for many, many acres in SW Ontario. Analysis of the soil on any field with high yielding crop yields will normally indicate above average levels of potassium (>150 ppm, 3-5% BCSR). These soils require annual maintenance levels of potassium to ensure K removal is matched with annual applications of K. This requirement can be achieved with a combination of preplant broadcast application of K, adding K at a safe rate to the planter mix and foliar applications to ensure adequate K during reproductive growth.
In our Case Study, we will again create 3 zones for potassium using the K ppm layer. The lowest zone will receive 300 lbs of Muriate of Potash (KCI)5.
VRT Scripts for Muriate of Potash and Sulphate of Potash for Hardy Farm
Case Study Summary
- Variation in Prescriptions based on Agronomist/Region/Crops
Experienced Agronomists6 will likely challenge the assumptions and rates chosen for the scripts. This is ‘awesome”. If the Agronomist has proper “experience” with a different set of brackets for key nutrients, such as potassium and magnesium, in their region and an understanding of the response to fertilizer applications for the crops grown, then the scripts can be modified in almost infinite ways.
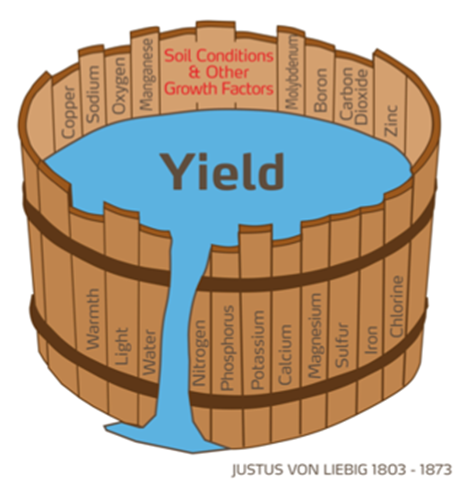
- Liebig’s Law7 and SoilOptix® Technology and the Future of Global Food Production
The key principle is to understand the imbalances that exist within a field and to manage the variability using a way that improves yield and quality. SoilOptix® technology provides a tool that can be used on any field on planet earth to pull apart the complexities of the soil. Understanding and managing the complex soil system is critical to our goal of feeding the world, reducing hunger, and making the world a healthier place for all!
Footnotes:
[1] Sulphate of Potash, commonly referred to as KMag, has an analysis of 0-0-22-11Mg-23S.
[2] The %BCSR for Mg has been chosen to create zones for KMag application. The Mg-ppm layer is an alternative option and the Agronomist should explore amending with both layers to see which layer is the “best fit”.
[3] The rate for a “middle” zone can be adjusted to suit the Agronomist’s goal for the field and/or the ability of the equipment to apply distinct rates.
[4] This rate could be pushed as low as 75 lbs/acre, if the equipment has the capability.
[5] Muriate of Potash (KCl) has an analysis of 0-0-60 and is the most economical method of increasing potassium. The authour has clients who have suffered salt damage to corn crops from applications of KCl at 600 lbs/acre 6-7 months prior to corn planting. This salt damage, expressed as desiccation of the corn seed will limit grain yield.
[6] Experienced Agronomist is defined as more than 10 years of front-line recommendations with farmers and interpretation of over 25,000 acres of soil analysis results – with a good knowledge of how and where the samples were taken.
[7] Liebig’s Law was able to prove the scientific concept that total crop growth is limited by the scarcest nutrient available. Nutrients must be supplied in “balance” since loading up on a single key nutrient, such as nitrogen, will not improve yield or quality in an efficient, sustainable manner.
About The Author
Steve Redmond; BSc
Steve Redmond has 35+ years of agricultural experience including crop protection roles in R&D and technical support, seed sales, environmental/nutrient management, soil sampling and fertility recommendations. His experience with Wintex soil samplers, an Aeryon Scout drone, GreenSeeker/Y-Drop applicators and NDVI imagery, VRT seeding and fungicide applications prepared him to enthusiastically embrace the SoilOptix® sensor technology. Now semi-retired, Steve continues to work on projects of interest including “SoilOptix® Agronomy”, balanced nutrition for culinary farms and Irish history.
Connect with Steve: