Mapping sustainable and unsustainable land for a longer term is an incredible way to ensure proper planning and the ideal way to move forward. Think of soil mapping in USA agriculture as a much larger version of testing the soil profile in your garden. Let’s dive deep into this topic and see how it can help your agricultural efforts.
At just the beginning of your growing season, most farmersdecide to test their soil. It’s essential to determine whether you need to add fertilizer to your garden or not to provide your plants with all the vital elements they need to grow strong and healthy crops. You want to plant your farmland with limited quantities of a particular nutrient in the ground. Thus, in the long run, this practice could cause problems for your plants not performing as expected.

Understanding soil mapping in agriculture:
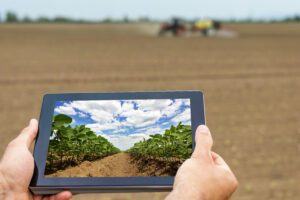
Soil survey, or soil mapping, is classifying the soil types and properties in a particular area and geo-encoding such crucial information. It applies principles of soil science and draws heavily from geomorphology, the theories of soil formation, physical geography, and thorough analysis of vegetation and land use patterns. Field sampling and remote sensing acquire primary data for the soil survey. Remote sensing principally employs aerial photography, but LiDAR and other digital techniques are rapidly gaining popularity. In the past, a soil scientist took hard copies of aerial photography, topo-sheets, and mapping keys into the field. Today, a growing number of soil scientists use ruggedized tablet computers and GPS in the field with them. The tablet may be loaded with digital aerial photos, LiDAR, topography, soil geo-data bases, mapping keys, and more.
Why is soil texture important?
Soil texture is one of the most vital properties to know how to measure, as it affects many other chemical, physical, and biological soil processes and properties such as the available water-holding capacity, the water movement through the soil, soil strength, how easily pollutants can leach into groundwater, and the natural soil fertility.
By knowing the soil’s texture and the topsoil depth, a producer can estimate the amount of water available to produce a crop. Sand can hold between 0.5 and 1.0 inches of water per foot of the soil depth if the soil texture is sandy. If a producer had four feet of topsoil, 2 to 4 inches of water is available for the crop’s use. If the soil texture is quite sandy loam, there is 1.0 to 1.5 inches of open water per foot of topsoil. Suppose the soil texture is silt or clay loam, with 1.5 to 2.0 inches of available water per foot of the topsoil. If the soil texture is clayey, there is 2.0 to 2.5 inches of the available water per foot of the topsoil area. SoilOptix® offers a complex model layer called Plant Available Water (PAW) that utilizes some of these principles, along with other calculations, to provide this layer of soil information.
How do 3D soil maps aid farmers?
It has become a common practice in precision farming practices, which employs the most cutting-edge technology to acquire the most accurate information about the condition of the soil layer, the weather, and the crops. Farmers benefit from this technique in the following ways:
-
Composition of the soil:
Understanding which soil element exists is critical to determining which crops or varieties best suit every land parcel.
-
Check humidity:
It is critical to understand the humidity of every crop area. This permits better irrigation management. This check is usually carried out using the soil temperature maps.
-
Soil texture:
Knowing the soil texture permits farmers to determine which fertilizers they must apply at any given time and location.
-
pH and conductivity:
It is critical to estimate soil variables like pH and conductivity to better select fertilizers and other nutrients.
-
Fertility:
Knowing what extent of fertility may be expected from a land plot is essential for selecting the best crop cultivation periods.
The significance of mapping soil organic carbon in 3D:
At the centre of soil health and the rising adoption of regenerative agriculture lies the crucial factor of Soil Organic Carbon (SOC). To spearhead carbon sequestration efforts in agriculture, it is vital to accurately quantify SOC content in lateral landscape distribution and vertical soil profiles. Although the significance of 3D SOC mapping is quite evident, implementing such comprehensive assessments has been challenging–soils are incredibly diverse, and this variability extends well below the surface.
SOC catalyzes enhancing soil structure, fertility, and the water retention capacity. This natural reservoir contains more carbon than the terrestrial vegetation and is about the same as the atmosphere. By elevating the SOC levels, carbon absorption from the atmosphere is augmented, underscoring the crucial role of soils in addressing climate change. Since SOC content varies spatially across diverse landscapes and with depth in the soil profile, a comprehensive 3D mapping approach is needed. Such soil mapping in USA agriculture provides valuable insights into spatial distribution of soil organic carbon available, leading to much improved estimates of SOC stock levels and refined land management strategies to foster SOC accumulation.
In conclusion:
Thus, soil mapping is an indispensable tool in present-day agriculture because it gives us the needed information to reduce the margins of mistakes in agricultural practices. At SoilOptix®, we have various features designed to help farmers get the most information out of their soil for better management . Get in touch now to take your soil’s mapping to the next level!
