The amount of fertilizer needed per acre depends upon many factors, including the type of plant being fertilized. In addition, the amount of nitrogen in the ground must be considered before applying fertilizer. In crop production, using the right amount of fertilizer is undoubtedly one of the most essential things to ensure the achievement of the optimum crop yield.
Considering Liebig’s Law of the Minimum, it is clear that following the lack of moisture, low fertility comes as the second limiting factor, leading to low yield potential in the production of crops. Besides, in plant nutrition, the supply of such nutrients is essential for preventing or correcting a deficiency in a particular plant nutrient element. To achieve this goal, there is an inevitable need to utilize fertilizer recommendations based on soil tests. This brings us to the recommendation of fertilizers, which should be done correctly to ensure better crop response to the applied nutrient in the form of fertilizer.

Source: Freepik
Fertilizer recommendation philosophies based on soil tests
There are three types of fertilizer recommendation philosophies based on soil tests:
(1) Maintenance philosophy
(2) Nutrient sufficiency philosophy
(3) Consideration of cation balance.
Research results found that the nutrient sufficiency philosophy is agronomically and economically sound compared to others.
The fertilizer requirement can be related to nutrient status as shown by soil analysis, soil type, previous crop, organic manure use, and crop features such as variety and yield level. Based on scientific considerations, including conducting field experiments and considering crop removal of nutrients. Fertilizer recommendations are formulated at different levels, including but not restricted to the national and local groups, by a responsible coordinating agency.
For field crops, nutrient recommendations have evolved over the years based on observations and controlled field studies. For example, in Michigan, previously used tabular data for fertilizer recommendations were converted into recommendations equations in 1981. During the mid-1990s, specialists in soil fertility from Ohio, Michigan and Indiana elaborated recommendations by developing a set of common nutrients for soya beans, corn, alfalfa and wheat. The conceptual model used for these recommendations is followed for recommendations of potassium and phosphorus.
Only general guidelines will be given here since fertilizer recommendations are specific to the area and crop. They must be modified to fit the soil type, the climate, and the yield goal of the farmer for a particular site. A farmer needs to have realistic yield goals when planning a fertilizer program.
Can soil health tests determine fertilizer needs?
Yes, indeed! Soil tests help measure soil health indicators such as microbial activity, the amount of carbon in the soil and nutrient availability. While these tests can be helpful for contrasting management practices, they shouldn’t be used to determine fertilizer application rates.
Soil tests show you characteristics of your soil that you can’t see or feel but are crucial for healthy grass and plant growth. Your soil analysis will tell you about the nutrients in your soil, the soil’s pH, the amount of organic matter it contains, and more — if you know what to look for.
What’s included in a soil test report?
The format of your soil test report will look different depending on where you get the test, but the content itself is mostly the same no matter where you go.
Here are the essential elements of a standard soil test and what they all mean.
The bulk of your soil test report will show the quantity of each plant nutrient in your soil. Some reports also may include a graph showing whether the recorded amount of each nutrient is low, optimum, or high.
What are these so-called nutrients, and why are they important? Plants need certain nutrients to grow strong and healthy, just like humans need our vitamins. Plant nutrients fall into one of three categories:
Primary nutrients: Nitrogen (N), phosphorus (P), and potassium (K)
Secondary nutrients: Magnesium (Mg), calcium (Ca), and sulphur (S)
Micronutrients: Boron (B), zinc (Zn), iron (Fe), manganese (Mn), chlorine (Cl), copper (Cu), molybdenum (Mo), nickel (Ni), and cobalt (Co)
Plants need an enormous amount of primary nutrients. They require significant amounts of secondary nutrients but less than primary nutrients. Micronutrients are still crucial for plant health, but they only need a small amount.
Your soil test might measure all or only some of the abovementioned nutrients. If you don’t see the full names of these nutrients on your report, look for their chemical symbols (the one- or two-letter abbreviation).
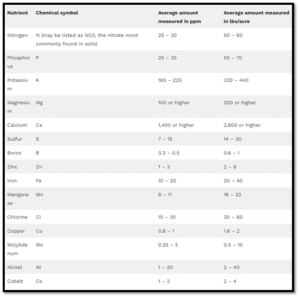
Different labs may report the quantity of each nutrient in parts per million (ppm) or pounds per acre (lbs/acre). The ideal measurement of each nutrient varies depending on your soil’s texture, CEC, base saturation, and the plants you’re trying to grow.
The average measurement of each nutrient for most soils is listed in the table below. These are the measurements you will likely see on your soil report. If your soil’s measurements are higher or lower, you may need to alter your soil to support healthy plant growth.
Healthy nutrient levels

Source: https://lawnlove.com/
It may seem strange that the average measurement of some secondary and micronutrients is higher than that of primary nutrients. But just because your soil contains a certain amount of a nutrient doesn’t mean your plants will get that much. How much nutrient your plants can absorb depends on base saturation, soil pH, and CEC. All the characteristics of your soil are related.
Your soil test report may also include sodium (Na), but sodium is not a plant nutrient. The sodium measurement concerns your soil’s salinity or salt content.

Source: https://lawnlove.com/
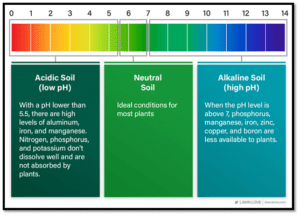
Soil pH, which measures soil acidity or alkalinity, only takes up one line of your soil report, but it’s just as essential to plant health as plant nutrient levels. Your soil’s pH determines how well your soil can absorb each nutrient. Diverse nutrients are more or less available to your plants at different pH levels. Soil pH is always measured on a scale of 0 to 14.
Most plants and grasses thrive in a neutral pH of around 6 or 7, but many prefer acidic or alkaline soil. So, the ideal soil pH for your yard depends on what you want to grow.
Buffer pH:
Your soil test report also may include a buffer pH measurement. A number will only be in the buffer pH spot if your soil is too acidic. The buffer pH you see on your report results from your ground mixed with a lime solution (called a “buffer test”) in the lab. Use the buffer pH to determine what quality of lime is required to add to your soil to neutralize its low pH.
Cation exchange capacity (CEC)
Cation exchange capacity (CEC) is a complicated scientific concept. Still, you must know that it measures your soil’s ability to store certain nutrients and release them for plant uptake.
The “cation” part of CEC refers to positively charged ions, which remain in the soil root zone thanks to their positive charge and don’t leach out of the soil easily.
Plant nutrients that are cations include:
- Potassium
- Calcium
- Magnesium
- Iron
- Manganese
- Copper
- Zinc
CEC measures your soil’s ability to hang on to these nutrients. Your soil test report will show CEC measured in milliequivalents of charge per 100 grams of soil (meq/100 g) — but you need not know what that means to understand what your soil test is telling you.
The vital thing to remember for you is that the higher your CEC measurement is, the less likely your soil is to leach (lose) nutrients. Add organic matter or lime to your soil to increase its CEC.
The target CEC range for your soil depends on your soil type (sandy, clay, loam, etc.) and pH, so we can’t give you an exact number to look for.
See the table below for the average CEC of different soil types at a neutral pH 7.0. If your soil pH is below 7.0, your CEC will likely be lower than the values presented here. If your soil pH exceeds 7.0, your CEC is probably higher, too.
Base saturation
If your soil analysis includes base saturation (not all of them do), it will be listed under “base saturation,” “% saturation,” or a similar variant. Sometimes, reports list the saturation of each measured nutrient separately, in which case you would see multiple measurements such as “K saturation,” “Mg saturation,” etc.
What does it mean now that you’ve located base saturation on your soil report? Base saturation is the percentage of the soil’s CEC taken up by base cations (as opposed to acid cations, which can be toxic to plant growth).
The base cations in soil include:
- Potassium
- Magnesium
- Calcium
- Sodium
If your soil test includes base saturation, you’ll see a percentage listed for each of these four elements.
Just like with CEC, the soil’s base saturation increases with soil pH. Higher base saturation usually means more fertile soil because soils with a high base saturation contain fewer toxic acid cations and more essential plant nutrients, potassium, magnesium, and calcium (recall that sodium isn’t a nutrient).
Compare the base saturation on your soil test results to these values to determine if your soil contains too much or too little of these elements for optimum plant growth.
Organic matter (OM)
Organic matter is any material from a living thing, including plants and animals. All soil is made of part organic matter and part rock particles.

Source: Freepik
Organic matter in the soil includes:
- Plant material such as decomposed leaves and grass clippings
- Microorganisms such as fungi and earthworms that help the decomposition process
The organic matter (OM) measurement on your soil test shows the percentage of your soil that this organic matter takes up. In general, the higher the OM percentage, the healthier the soil. OM in soil improves water infiltration, increases water holding capacity and CEC, and makes soil easier to cultivate.
Soluble salts (salinity)
Not all soil tests include a soluble salt measurement. But if yours does, it should be labelled “soluble salts.” The results will be reported in millimhos per centimeter (mhos/cm), a unit that measures soil conductivity.
If your soil test includes a soluble salt measurement, the ideal result is 0.8 mhos/cm or less. Soils with more soluble salts than that are considered saline; only salt-tolerant plants can grow in them. Excess soluble salts can dehydrate soil and cause drought stress in most grasses and plants.
On soil test reports that don’t include a soluble salt measurement, look at your sodium measurements to indicate excess salt problems. Too much sodium results in sodic soil, which usually has a high pH and causes plant rooting issues.
A fertilizer analysis measures the percentage of nutrients by weight in a fertilizer, and is printed prominently on the bag. For example, a 50-pound fertilizer bag labelled 13-13-13 will contain 6.5 pounds of nitrogen, 6.5 pounds of phosphorous as phosphorous oxide (P205), and 6.5 pounds of potassium as potassium oxide (K2O), potash.
A 13-13-13 bag (called Triple 13) is an example of a complete fertilizer because it contains all three primary nutrients. The cost for a 13-13-13 will be around $12 per 50-pound bag. While complete fertilizers often are used in food plots, they are not always the best or most cost-effective choice. High-analysis fertilizers cost only a little more ($12 to $20 per 50-pound bag), but they may contain more than twice the amount of the nutrient needed. For example, a 50-pound bag of ammonium nitrate (34-0-0) includes 17 pounds of nitrogen; a 50-pound bag of triple superphosphate (0-46-0) contains 23 pounds of phosphate; and a 50-pound bag of sulphate of potash (0-0-50) includes 25 pounds of potash.
When used correctly, high-analysis fertilizers improve soil nutrients without overfertilizing. The money saved when using high-analysis fertilizers is realized when planting multiple acres over the years.
Applying excess fertilizer is poor environmental stewardship and is never recommended. The cost, labour, and stewardship benefits are realized even more when a test returns and only nitrogen is needed, which is relatively standard.
How are fertilizer guidelines developed?
The standard process
When soil is sent for analysis, the laboratory uses specific procedures and extractants to determine a nutrient’s estimated availability. Different extracts and processes typically result in other estimates of nutrient availability.
The correlation process helps determine the relationship between plant nutrient uptake or yield and how much of a nutrient is extracted from the soil. A soil test is considered correlated when lower yield and plant growth can be predicted at lower soil test values and higher yield and plant growth can be expected at higher soil test values.
Then, it’s essential to determine how much fertilizer is needed to meet crop nutrient needs at different soil test levels. This is called calibration.
The risk of relying on non-standard tests for fertilizer rates
Like the Haney test, soil health tests can give you a snapshot of soil characteristics not typically measured by standard testing procedures. You can use them to help demonstrate contrasts in management practices.
However, using non-standard soil tests to determine fertilizer application rates can result in the following:
- Higher input costs.
- Potentially negative environmental impacts from over-applying nutrients.
- Reduced yield and profits if you apply fewer nutrients than a crop needs.
Examples of Fertilizer Recommendation Calculation
As detailed, below are examples of computing fertilizer recommendations for some macronutrients and micronutrients needed in crop production.
Example: For a mineral soil where soybean will be grown, ST is 10 ppm, CL is 15 ppm, CR is 0.80 lb P2O5/bu, and YP is 40 bu/a. Calculate the recommended amount of P2O5 in pounds per acre for achieving the potential yield of soybean.
Calculation:
The soil test falls in the buildup zone since the ST is less than the CL. Therefore, the computation of the amount P2O5recommended will be given by:
ü
Buildup equation for P: lb P2O5/A to apply = [(CL – ST) x 5] + (YP x CR)
= [(15 ppm-10 ppm) *5] +(40bu/a*0.80 lbP2O5/bu) = (25+32) lb P2O5/a= 57 lb P2O5/a
Ø
Since 1pound/acre=1.12085116kg/ha, hence 57 lbP2O5/a = (1.12085116*57) kg P2O5/ha =63.8852kg P2O5/ha
The amount of P2O5 recommended is equal to 63.8852kgP2O5 /ha.
Note:
Generally, P soil tests are evaluated as low, medium, high, and very high. Low soil tests will require additions of phosphorus fertilizer that exceeds the quantity removed by the crop being grown because phosphorus added in the fertilizer becomes fixed. Soil testing medium in phosphorus will require applications of slightly more than that the crop draws for good yield and growth. When the soil test is high, no yield response is expected to the phosphorus fertilizer. In such cases, different fertilizer management approaches may be followed. Firstly, a starter fertilizer banded during planting may apply a maintenance amount of phosphorus. The intent is to use the phosphorus amount removed by the growing crops to maintain the high soil test. No phosphorus fertilizer is applied, and the soil is frequently retested to determine when phosphorus must be used again.
When the soil test is too high in P, the probability of phosphorus being lost to surface waters through runoff and erosion is high. To reduce the risk of environmental degradation, phosphorus fertilizer should not be applied to soil testing very high in P. The soil should be retested frequently to determine when phosphorus levels are reduced to the point at which the addition of phosphorus is required again.
Consistency of the soil test lab recommendations
Soil sampling, its analysis and interpretation are based on science, but there is great variation between methods. Reasonable precision and accuracy are needed to manage fertilizer inputs and maximize returns on investment efficiently. Over the years, various growers, agencies and companies have sent not accurate but duplicate samples to different labs to compare their analyses and recommendations. Growers may also be frustrated by this because values, as well as recommendations, will undoubtedly vary. This is why it is that crucial to track soil test levels from year to year and keep using the same lab.
Ask for actual soil residual nutrient measurements and the lab’s recommendations. If these recommendations are not in line with fertilizer rates you will use based on actual soil residual levels, ask the lab how its recommendations are calculated. This will help to understand better how specific production practices might at times lead to differences in recommendations.
In conclusion
It is good practice to test soil in food plots every 2 to 3 years or more often if plots are unsuccessful. It considers how the supply of nutrient elements that are insufficient in crop production can contribute to increasing crop yield. Adequate correction or prevention of nutrient insufficiency using fertilizers should be done by following proper fertilizer recommendations. The recommended fertilizer amount needs to be computed in the same way mentioned above. Keep a log with the dates of lime and fertilizer applications, planting rates, and herbicides used to monitor success and to make improvements over the years. Installing exclusion cages (4’ × 4’ × 4’ cages) in plots is also a good idea to discern heavy wildlife browse from failed schemes.
For help interpreting soil test results, contact your local ag retailer or consultant. Doing so, a considerable increase in crop yield can be expected in crop production. However, it is highly recommended to rely on experts when it comes to fertilizer applications based on your soil’s test report.
Our experts at SoilOptix® can help you in the best possible way. Get in touch at +1 (519) 902-7645 now!
