

The Power of One Acre
On the farm, every acre counts—but some acres count more than others. Picture this: a 100-acre field where one small patch, perhaps just a single acre, quietly dictates the economics of the season. If it’s neglected, it siphons yield potential and wastes inputs. If it’s managed properly, it turns from a liability into a profit driver.
This isn’t just a clever metaphor. With high-resolution soil mapping, farmers can now see their land in unprecedented detail—down to the square meter. Technologies like SoilOptix® reveal the variability hidden beneath the surface and highlight profit hotspots: small, high-impact zones where the right management decision can swing the economics of the entire field.
Why Whole-Field Thinking Falls Short
For decades, soil fertility management relied on whole-field averages or coarse grid sampling. Traditional composite soil sampling, for example, might involve taking 15–20 cores across a 20-acre zone, blending them together, and sending them to the lab [1]. The result? An “average” reading that masks variability.
The problem is that soils aren’t uniform. Within a single field, pH might range from 5.4 to 7.2, organic matter from 1.5% to 5%, and potassium levels from deficient to surplus [2][3]. Treating that field as one homogeneous block means oversupplying some acres and starving others. Both scenarios cost money, either through wasted inputs or lost yield.
What Makes Profit Hotspots?
Profit hotspots aren’t just about yield—they’re about return on investment. These are localized zones where the right intervention pays back disproportionately. They may be:
- Low pH patches that benefit dramatically from lime.
- Organic matter-rich soils that support higher seeding populations.
- Nutrient-deficient strips where targeted fertilizer unlocks hidden yield.
- Soil texture variations (sand vs. clay pockets) that require different water or nutrient strategies.
Traditional approaches blur these differences. Soil mapping makes them visible and, importantly, actionable.
The Science Behind Soil Mapping with SoilOptix®
What sets SoilOptix® soil mapping apart is the sheer density and precision of its data.
1. Gamma-ray spectroscopy
- SoilOptix® uses a passive gamma sensor mounted about 60 cm (2 ft) above the ground.
- As it passes over the field (12 m swath width, up to 20 km/h), the sensor measures natural emissions of isotopes like potassium-40, uranium, and thorium.
- These isotopes correlate with soil texture, mineralogy, and other baseline properties [4].
2. Ground-truth sampling
- To calibrate the radiation readings, SoilOptix® integrates physical soil samples (as few as one per 8 acres).
- These samples are analyzed in the lab for nutrient levels, organic matter, and pH, anchoring the gamma data to agronomic reality [5].
3. High-resolution output
- The combination yields a staggering 335 spatial data points per acre (827 per hectare).
- Farmers receive detailed maps of more than 25 soil properties, including:
- Physical: sand, silt, clay, organic matter
- Macro & micronutrients: P, K, Ca, Mg, S, Zn, Mn, B, etc.
- Soil health indicators: organic carbon, cation exchange capacity (CEC), pH [5].
4. Fast turnaround
- Within 48 business hours, data is processed through the SoilOptix® Automap AI pipeline.
- Results are delivered in SHP/CSV format, ready for agronomists to build variable-rate prescriptions in platforms like John Deere Ops Center or Climate FieldView [6].
This scientific system transforms vague averages into ultra-high-resolution soil intelligence—a necessary foundation for precision profitability.
Case Story 1: Western Canada Barley Field
A real-world example in Western Canada illustrates the stakes. A barley field mapped with SoilOptix® revealed a landscape of hidden variability:
- Suboptimal pH zones and calcium/magnesium imbalances that weren’t detected by conventional sampling.
- Yield data revealed staggering differences—from just 7 bushels/acre in the weakest zones to 139 bushels/acre in the best areas [7].
- By targeting lime and nutrient inputs precisely, those weak acres began pulling their weight instead of draining profitability.
This case highlights a truth: one overlooked acre can hold back the whole farm. With high-resolution soil mapping, those acres become visible—and profitable.
Case Story 2: The Advantage Over Zone Sampling
In another comparison, a grower tested SoilOptix® soil mapping against traditional zone sampling. The outcome was eye-opening:
- Zone sampling missed subtle variability in nutrient and organic matter levels.
- SoilOptix® identified pockets where fertilizer applications could be reduced, saving input costs, while pinpointing areas that justified higher rates to maximize yield.
- This dual strategy—spending less in some places, more in others—produced a better overall ROI [8].
It wasn’t about applying more inputs—it was about applying them smarter.
Case Story 3: A “No Cookie-Cutter” Approach
Another SoilOptix® case study emphasized that fertilization strategies can’t be one-size-fits-all. In this field:
- Soil variability was so pronounced that blanket recommendations would have led to both over- and under-application across the field.
- SoilOptix® layers correlated tightly with yield variability, proving that management decisions needed to be tailored acre by acre [9].
- The lesson: profit hotspots exist, but only mapping reveals them.
The Economics of One Acre
The economics of farming aren’t just about yield—they’re about optimizing inputs.
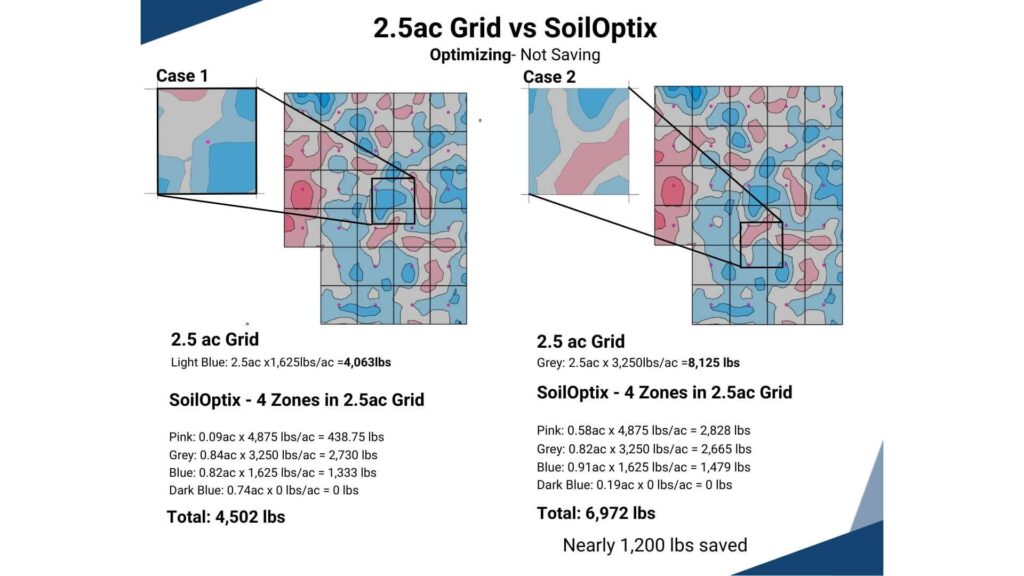
Traditional 2.5-acre grid sampling often produces blanket recommendations, treating the whole zone as if it were uniform. SoilOptix® soil mapping, on the other hand, reveals the variability within that same 2.5-acre block—breaking it into multiple subzones that require different management strategies.
In one case study, a 2.5-acre grid zone was divided into four unique management zones. Instead of applying the same rate everywhere, SoilOptix® maps showed that some areas required higher applications, while others needed little to none. The result was a savings of nearly 1,200 lbs of product applied—not by cutting corners, but by placing inputs where they truly mattered.
This demonstrates the power of identifying and managing profit hotspots. The key isn’t to raise the yield of every acre equally but to direct resources where they deliver the greatest impact—the acre that pays.
Farmer and Agronomist Perspectives
Farmers who adopt SoilOptix® often note two things:
- Confidence in decision-making
Instead of guessing, they know precisely where to place fertilizer, lime, or seed. - Better conversations with advisors
Agronomists can build prescriptions based on real variability instead of assumptions, strengthening the partnership between farmer and advisor.
For many, the data doesn’t just change one season’s profitability—it reshapes how they think about their land for years to come.
The Future of Profit Hotspots
The future of soil mapping is about more than nutrients. With AI and machine learning, SoilOptix® soil mapping continues to evolve, improving the accuracy of soil property predictions and integrating with digital farm management platforms.
Looking further ahead, growers can expect:
- Integration with sustainability metrics like carbon accounting and water efficiency.
- Predictive models that show not only today’s profit hotspots but also tomorrow’s risks and opportunities.
- Global adoption—as the technology scales into new crops, geographies, and industries like turf and sports management [6].
Conclusion: Profit, Acre by Acre
Farming has always been about scale—but in the age of precision, it’s also about focus. Sometimes it only takes one acre to change the economics of an entire field.
SoilOptix® soil mapping empowers farmers to see their fields not as uniform blocks, but as mosaics of opportunity. With 335 data points per acre and insights into more than 25 soil properties, it transforms invisible variability into visible profit hotspots.
The lesson is clear: don’t aim to change every acre at once. Find the acre that pays—and start there.
🔗 Learn more at soiloptix.com
References
[1] Purdue Extension – Soil Sampling for Nutrient Management. Available at:
https://www.extension.purdue.edu/extmedia/AY/AY-368-w.pdf
[2] Iowa State University – Zone Sampling & Variability Studies. Available at:
https://www.agronext.iastate.edu/soilfertility/info/ICM_2001_ZoneSampling_Publ.pdf
[3] Soil Science Journal – The Variability of pH in Acid Soils. Available at:
https://journals.lww.com/soilsci/fulltext/1990/10000/the_variability_of_ph_in_acid_soils_of_the.4.aspx
[4] SoilOptix® – How Effective is Gamma Radiation Spectroscopy for Soil Mapping?. Available at:
https://soiloptix.com/our-blog/how-effective-is-gamma-radiation-spectroscopy-for-soil-mapping-in-agriculture/
[5] SoilOptix® – How It Works. Available at:
https://soiloptix.com/what-is-soiloptix/how-it-works/
[6] SoilOptix® – Our Technology. Available at:
https://soiloptix.com/what-is-soiloptix/our-technology/
[7] SoilOptix® Case Study – No Cookie-Cutter Approach to Fertilization (Western Canada barley yields 7–139 bu/ac). Available at:
https://soiloptix.com/wp-content/uploads/2024/01/SO-Case-Study-3-No-Cookie-Cutter-Approach-to-Fertilization-Strategies.pdf
[8] SoilOptix® Case Study – A Clear Advantage Over Zone Sampling. Available at:
https://soiloptix.com/wp-content/uploads/2024/04/SO-Case-Study-4-A-Clear-Advantage-over-Zone-Sampling.pdf
[9] SoilOptix® Case Study – No Cookie-Cutter Approach to Fertilization Strategies. Available at:
https://soiloptix.com/wp-content/uploads/2024/01/SO-Case-Study-3-No-Cookie-Cutter-Approach-to-Fertilization-Strategies.pdf
[10] SoilOptix® – Economic Value of High-Resolution Mapping. Available at:
https://soiloptix.com/what-is-soiloptix/our-technology/