
By: Steve Redmond; BSc
Introduction
One of the questions that always arises when new technology, especially Precision Ag offerings, is presented, with exuberance, to cautious farmers can be summarized as follows.
“Okay, the maps are pretty, so what?”
Or … “that don’t impress me much!” (Shania Twain; That Don’t Impress Me Much, 1997)
What farmers and emerging crop advisors are really saying is; “Okay, please help me understand how this technology, such as SoilOptix®, can help my bottom line?”. Show me the return-on-investment!
Using Plant Health Imagery from FieldViewTM
Satellite imagery has continuously improved over the past 15 years to a point where we now can receive weekly (or twice weekly) satellite images of any field on planet earth. When a business, such as Bayer’s Climate FieldView, uses NDVI imagery to create a Plant Health Image of a field, we now have an indexed image of the field showing the scale of plant growth. This NDVI index, or scale, has a high correlation to what is happening in the fields since ‘plants don’t lie”.
In other words, the growth of plants across a field at any stage is a snapshot of the health of the plants and therefore is a reflection of the soil health.
When you have technology such as SoilOptix® to give you a high-resolution picture of 25+ layers of information then you can begin to pull apart the “mystery” of why plant growth has such extreme variability.
VRT Phosphorus and Potassium:
To demonstrate how two fertility layers and two corresponding soil characteristic layers can unravel the mystery, we will look at this 25 Acre Case Study Farm to demonstrate how VRT phosphorous and VRT potassium can change crop growth season-over-season. FieldView’s in-season imagery database will demonstrate the change in plant health on this field.
In many fields that I have mapped, it becomes obvious that the ability to VRT phosphorous (P) and potassium (K) are the “low hanging fruit”.
What Layers Do We Need?
Although I always look at most of the SoilOptix®-derived maps like a child on Christmas morning, the ones we should rely on for VRT P and K are:
- pH
- Phosphorus ppm
- Potassium ppm
- CEC
- Base Saturation for Potassium (K)
- Base Saturation for Magnesium (Mag)
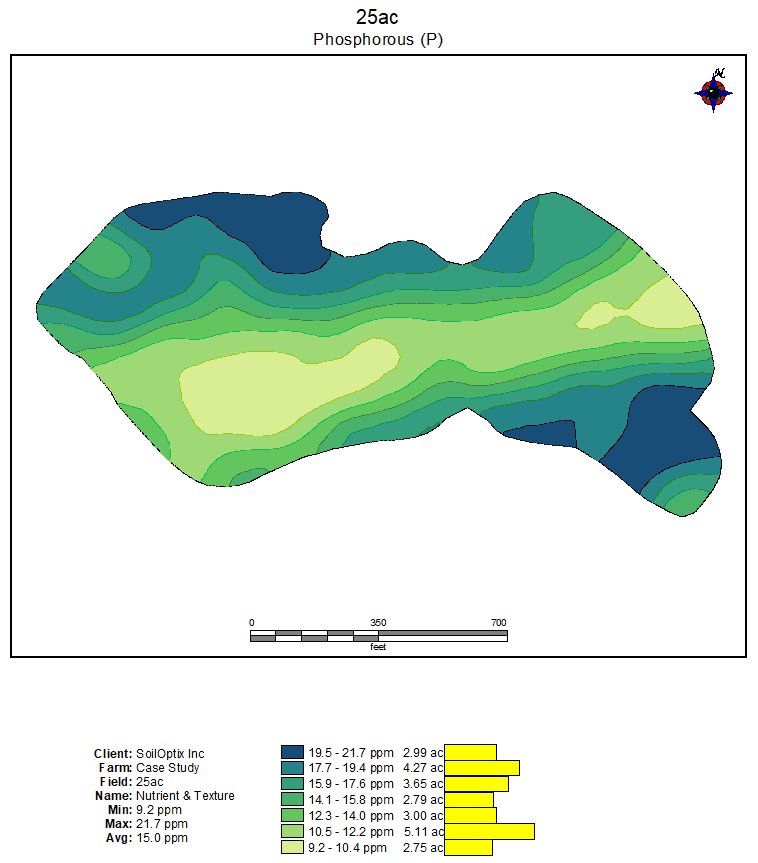
Phosphorus ppm Layer:
This layer shows us the wide variation that exists, naturally, in this critical nutrient.
With phosphorus as a major environmental contaminate, it is crucial that we manage applications of P with efficiency and utmost care.
Target for P:
I was taught to use a target of 25 ppm for sodium bicarbonate phosphorus. Areas of the field that are above this target level should receive a small amount of supplemental P – an amount that is much less than crop removal – while other areas should have applications that create a 4-5 year “build” to attempt to reach the 25-ppm target.
Target for K:
The target for potassium is 150 – 175 ppm for ammonium acetate potassium; although with potassium it is critical to also view the Base Saturation (BSCR) levels of potassium, magnesium, and calcium.
My target for BSCR potassium is 3-5%.
This is often the first hurdle that we must get over when discussing the cost of soil amendments. Raising the level of K in the soil requires approximately 30 lbs/acre of K2O (muriate of potash) for every 1-ppm increase in K to reach the target levels.
If we use a 5-year period as a target for building K, beyond crop removal levels, then it becomes a huge task to raise soil levels that are below 100 ppm or have a BSCR for K of 1-2%.
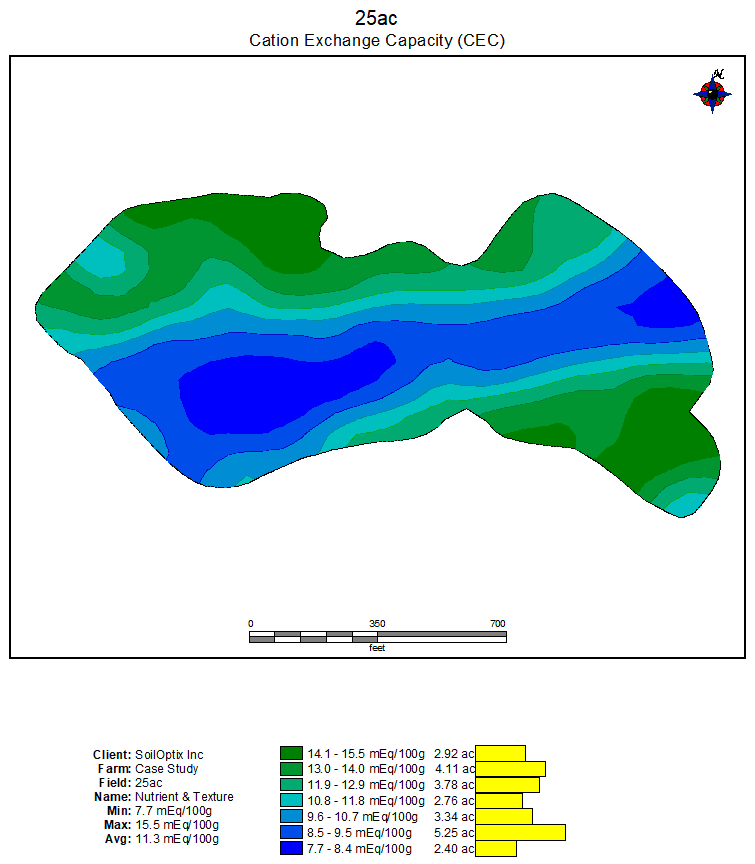
CEC Layer for 25-Acre Field
An analysis of the CEC for the 25-acre field shows that there is an area through the middle of the field where the CEC’s are less than 12 meq/100 grams. It is difficult to change CEC due to the factors involved in this soil characteristic. However, with an understanding that a CEC of 15 meq/100 grams is an “ideal” state, we can see that the area less than this “ideal” state is relatively uniform.
Phosphorous (ppm) Layer
The phosphorous (ppm) layer is quite “revealing” and shows that if P is one of the critical nutrients (and it certainly is) then the area with the lowest ppm matches up quite nicely with the area identified as the problem CEC layer.
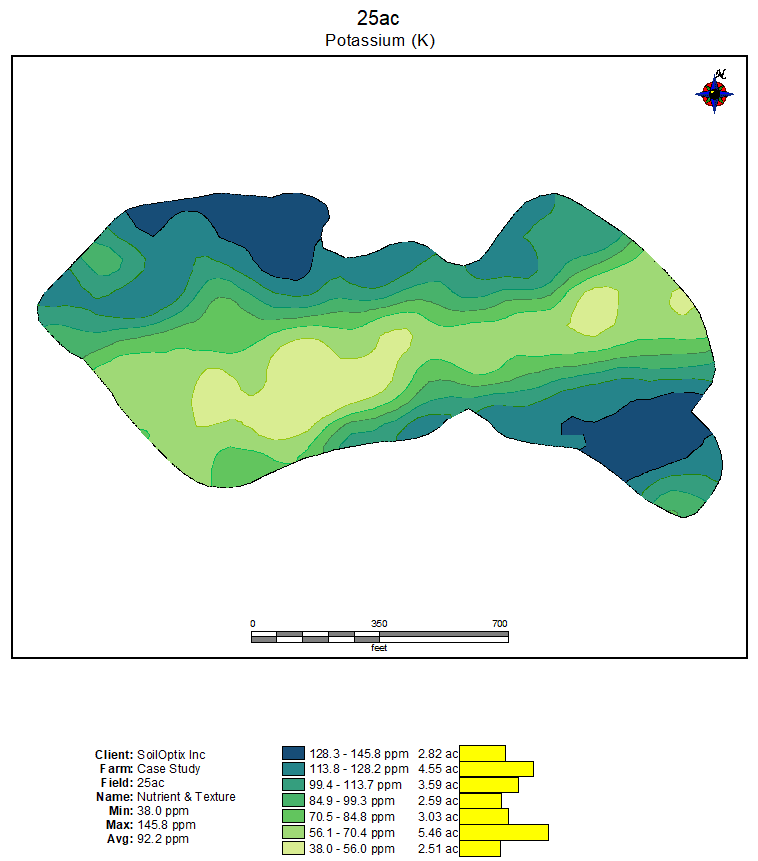
Potassium (ppm) Layer
Now when we bring the potassium layer in for analysis, we see that again this critical element is far below the target of 150+ ppm for optimum yield.
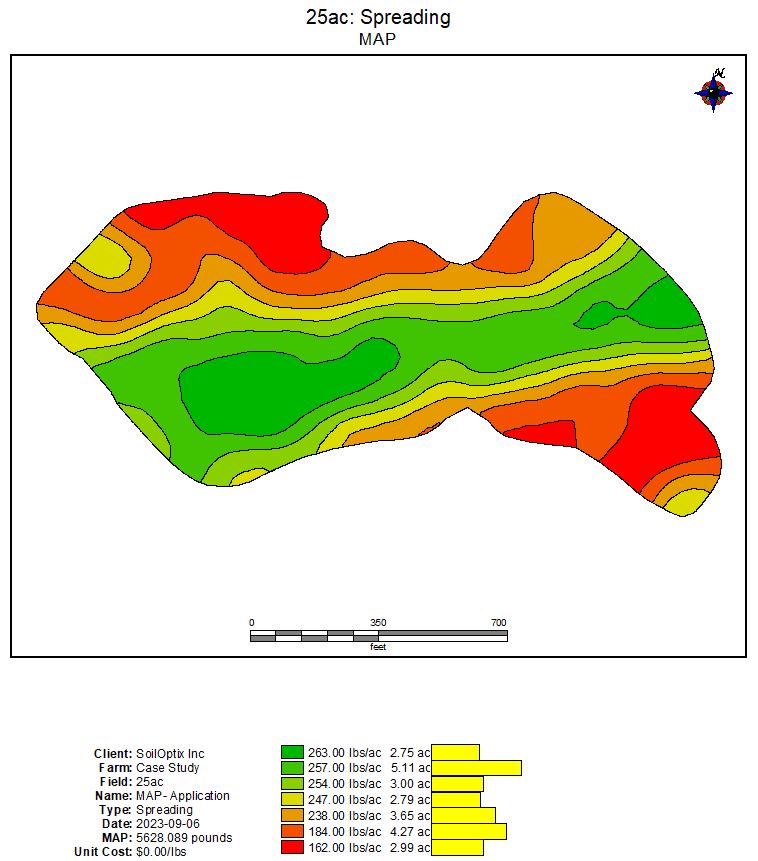
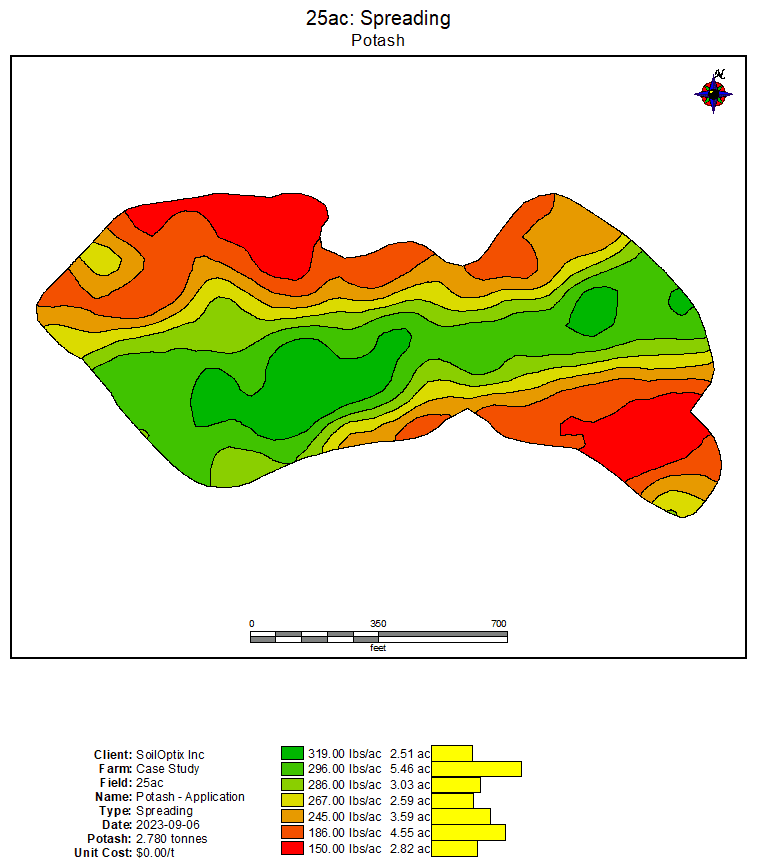
Scripts for VRT MAP & VRT Potash (KCl)
A simple script to add MAP in significant amounts to the middle area of the field, identified as the problem phosphorous area and a 2nd separate VRT script to add significant amounts of Muriate of Potash to the problem potassium areas is quite simple as the SoilOptix® layers have created the zones requiring the attention.
Validation using Plant Health Imagery
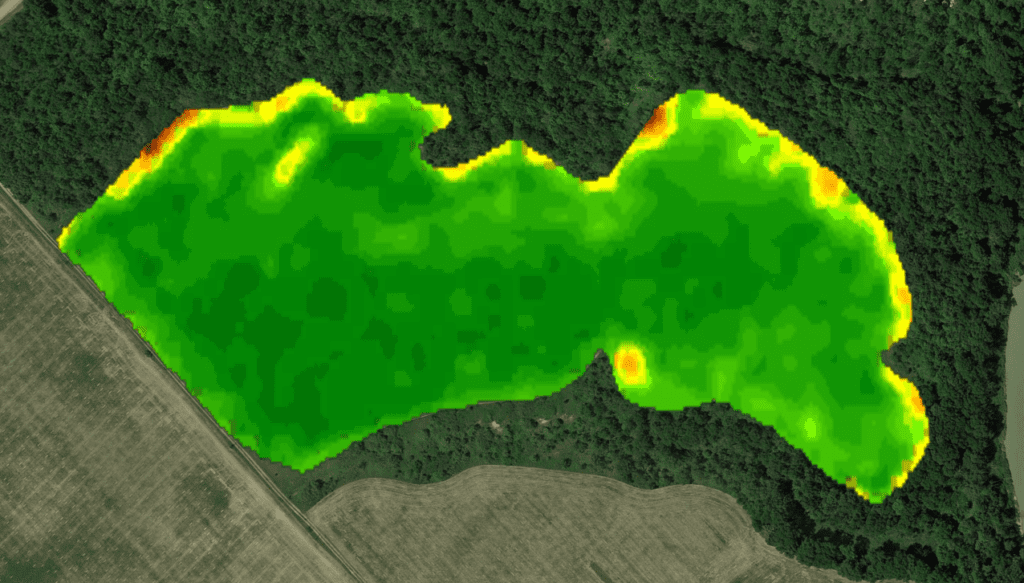
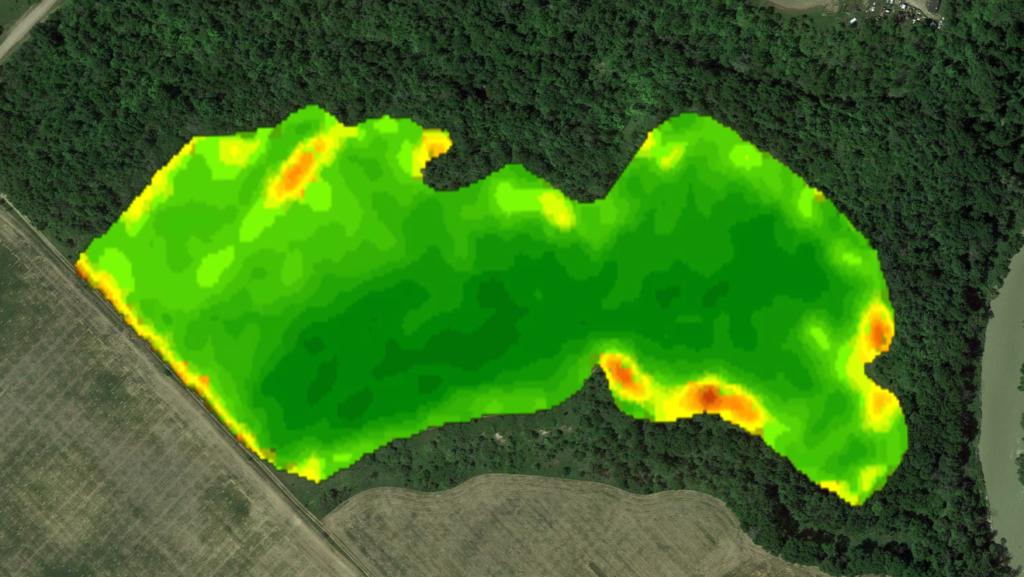
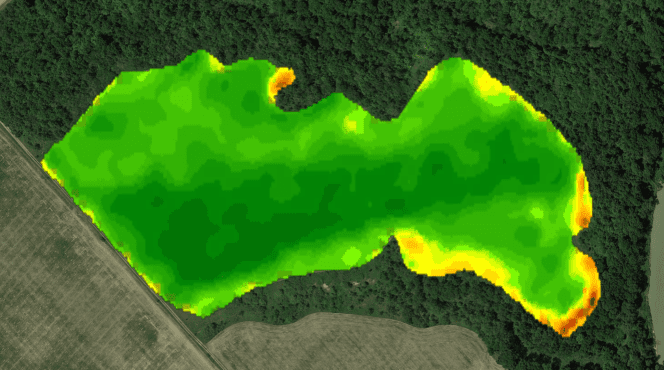
Now we will look at the In-Season imagery, provided by FieldView during the growing season after the spring VRT applications of MAP and Muriate of Potash and we see an amazing picture.
The NDVI image for both August 27, 2020 and September 3, 2022 show high NDVI levels through the middle of the 25-Acre Case Study field.
Normalized Difference Vegetation Index (NDVI):
The Normalized Difference Vegetation Index (NDVI) is a measure of the amount and vigor of vegetation on the land surface.
In general, NDVI values range from -1.0 to 1.0, with negative values indicating clouds and water, positive values near zero indicating bare soil, and higher positive values of NDVI ranging from sparse vegetation (0.1 – 0.5) to dense green vegetation (0.6 and above).
Indirectly, NDVI has been used to estimate the crop yields for different crop types, cumulative effective of rainfall on vegetation over a certain period and the quality of the environment as habitat for various animals, pests, and diseases.
High rainfall amounts, or flooding, that destroys crop growth will slowly deteriorate high NDVI areas and transition to yellow and then red areas indicating low NDVI and therefore low yield potential. Weekly or bi-weekly satellite imagery is interesting to watch when flooding occurs.
Confidence in NDVI Values
It may take some time for the reader to comprehend the value, or correlation, of the In-Season NDVI towards optimum yield, however it is “real”.
Although other issues, such as weather events, unmanaged diseases, or unharvestable yields can lead to poor correlation of the NDVI to final yield. In crops such as corn, the correlation is very high.
It is important to remember that the NDVI is always indexed to a particular moment in time such that the red areas always represent the lowest plant growth (yield potential) and the dark green areas, on the plant health map, represent the highest level of plant growth and therefore the highest yield potential.
Summary
Since products, such as FieldView, are available to allow us to view plant health images in-season, we can now go forward with VRT scripts with a level of confidence knowing that we can begin evaluating the impact that VRT scripts based on SoilOptix® layers can have on crop growth and final yield.
Consultants and farmers can embrace this aspect of Precision Agriculture with the knowledge that there are tools available, without needing a calibrated yield monitor, to provide an indication of the Return-on-Investment for both SoilOptix® and the consultant’s time to create the VRT scripts.
Finally, let’s always remember that “Plants don’t Lie”!
About The Author
Steve Redmond; BSc
Steve Redmond has 35+ years of agricultural experience including crop protection roles in R&D and technical support, seed sales, environmental/nutrient management, soil sampling and fertility recommendations. His experience with Wintex soil samplers, an Aeryon Scout drone, GreenSeeker/Y-Drop applicators and NDVI imagery, VRT seeding and fungicide applications prepared him to enthusiastically embrace the SoilOptix® sensor technology. Now semi-retired, Steve continues to work on projects of interest including “SoilOptix® Agronomy”, balanced nutrition for culinary farms and Irish history.
Connect with Steve: