
“What else can we do with this high-resolution soil information?”
By: Steve Redmond; BSc
As we progress through our Case Study series, you will notice that we have taken a purposeful journey through some of the basic uses of the SoilOptix® layers that allow an agronomist to amend a field for the “low hanging fruit”. These are the obvious soil nutrient deficiencies such as soil pH, base saturation problems and critical nutrient deficiencies. The next step for an agronomist is to ponder their brain on how to develop a VRT script for seeding using one, or a number, of the high-resolution layers.
The confidence to create an effective VRT seeding script comes from several thoughts percolating in the brain of any SoilOptix® agronomist:
- We understand that the field in question has a strong nutrient profile, or has been amended in a manner that is consistent with other fields in our repertoire (i.e. First, we have taken care of the low hanging fruit, and now ask ourselves “What’s next for this field?”)
- The limitations of the soil texture layers are understood, and we know that we can manage yield potential from the high-resolution layers that “lay” in front of us. (cool statement eh!)
- We see a high correlation between crop growth (NDVI imagery or Yield maps) and one or more SoilOptix® layers.
- The derived layers, such as Plant Available Water, give us another confidence boost that, yes, we can build an effective VRT seeding prescription that will increase the profitability on the field.
Cory Weber, a Precision Agriculture Specialist who works at an Ontario agriculture co-operative is one individual who has viewed the Plant Available Water layer and said, “I know that I can help farmers build a VRT script from this information”.
One of the keys to giving Cory Weber the confidence to take on this task is the availability of high-resolution yield maps that confirm the yield potential of the field. Most agronomists want to see at least two years of yield data for an individual crop before building the script. Although NDVI imagery is very powerful – and the author has experience with high correlation between in-season NDVI and harvestable yield – it is imperative (and yes, I agree) that strong yield maps are available before beginning this process.
This case study demonstrates how a VRT seeding script can be developed for field corn using the Plant Available Water layer with the knowledge that the historical yield data will verify the VRT script and prevent the crop consultant from making a grievous error that would reduce yield and profit.
Let’s get started!
The Agronomist will usually begin the process of VRT Seed Scripting with two layers that provide critical information:
- The Organic Matter layer –OM is a driver for soil moisture holding capacity, previous high yields, (think about it!), expected nitrogen release, nutrient availability and therefore yield potential.
- The Texture Layers. The content of sand and clay can be used in many ways. I have used the sand and clay layers to explain to farmers why levels of potassium can vary greatly within a field that appears to have no elevation differences, drainage issues, etc. The Agronomist in this case study has wisely factored these layers into his VRT Seeding layer.
Note to readers: This is the key component to why the SoilOptix® process works so effectively on a local level and why “boots on the ground” are essential to the process. Unless you have intimate experience with the soils, drainage, weather peculiarities and crop management practices in a specific area, it would be very hard to develop accurate VRT Scripts without that insight. I’m sure that someone will make an attempt to do this, and I wish them luck- but this author predicts a ~50% success rate with the efficiency of the VRT Seeding script.
High Plant Populations
Corn seeding rates are highly dependent on genetics, leaf architecture, drought resistance and other traits. Some hybrids have top end population recommendations of 38,000 to 40,000 plants per acre. These very high seeding rates are “dangerous”, and I have personally viewed a local seed company plot where potassium and nitrogen fertilization were not in place to support 40,000 plants per acre. The thin stalks and lodged corn in September are forever etched into my mind and reminds me how important balanced fertility is in high yield environments.
I can vouch for the requirement for extensive local knowledge of an area’s soils and crop management practices. When I moved to SW Alberta in December of 2023 and began to Crop Tour and make an attempt to understand the soils, seeding equipment, tillage practices, fertilizer delivery mechanisms, etc., I realized that although I have 35+ years of experience doing “this thing” I am simply an infant in another cropping world. I estimate that it would likely take me 4-5 years to develop the local knowledge to effectively develop VRT Scripts using SoilOptix® technology for farmers growing barley, field peas, canola and spring wheat under dryland conditions. “Oh, to be young again”.
Developing a VRT Seeding Script for Corn:
Experienced agronomists know that if we can identify high yielding areas in a field we can “push” the plant population of corn seed to a level that is 15-20% above the field average seeding rate. The savings, or efficiency, in the field comes with the knowledge that there are also areas that always yield below average due to soil type, soil compaction, etc.
The key starting point is Normalized Yield.
Normalized Yields:
Figure 1 shows the normalized yield map for the NW field. The Agronomist has pulled together the high-resolution yield maps for the winter wheat in 2023 and the soybean crop in 2022 (Figure 2). The field’s cropping history change resulted in incomplete yield data, influencing the decision to use PAW for creating zones. Although there’s preference to use corn and soybeans due to their similar growing seasons, wheat and soybeans had to be used. Using a proprietary software program that normalizes the yield, Cory Weber has created a map that shows Percent Departure from Average Yield.
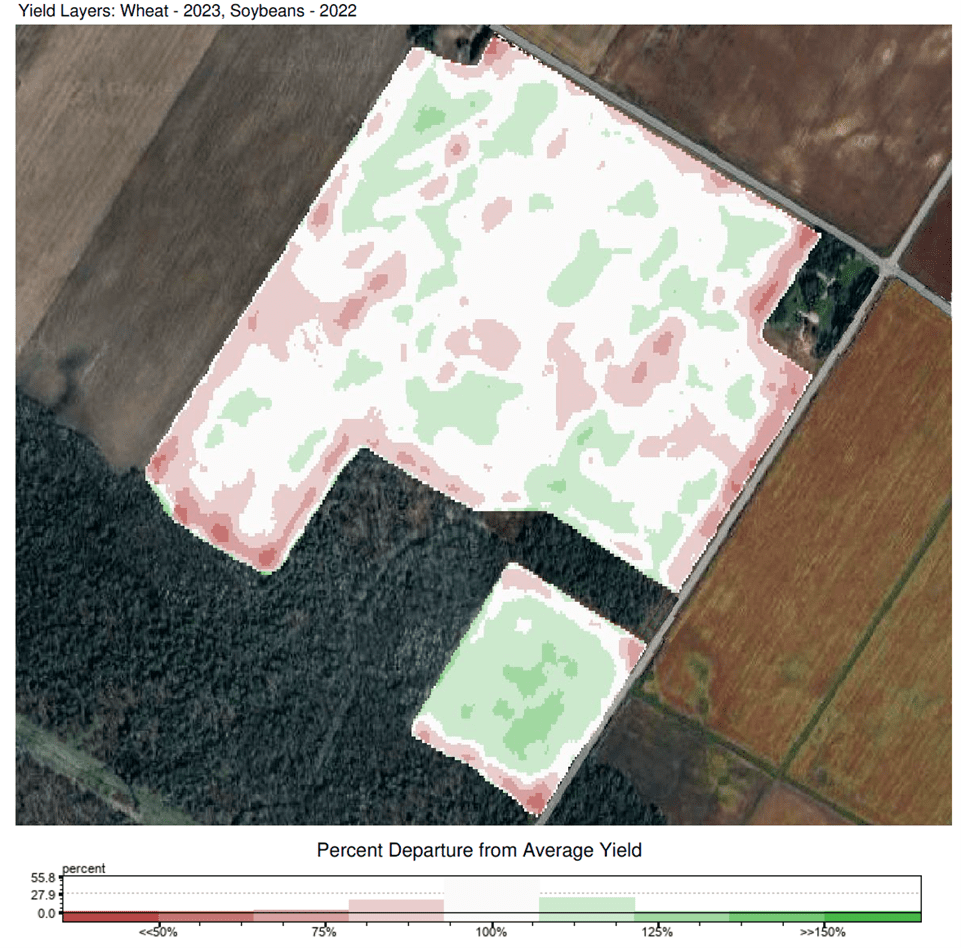
Figure 1: Normalized Yield map for NW Field
The resulting map and colour scale indicates that the dark green areas are areas of consistently high yield while the areas in shades of red are lower yielding areas.
Field borders are a problem, likely due to soil compaction which is very common in Ontario due to the high soil moisture level and the size and weight of tillage equipment, grain carts, etc. Field borders can also have yield losses contributed to animals like white tail deer, raccoons, etc.
There may be known yield areas within the field itself that provide the additional opportunity to reduce plant populations.
The VRT Planting Script and As-Applied Planting Map show how the Agronomist has “scripted” the field. Note the corn populations are pushed to over 39,000 plants per acre and test blocks are scattered throughout the field to validate the final yield and the decision-making process.
Wheat and Soybean Yield Maps for the NW Field
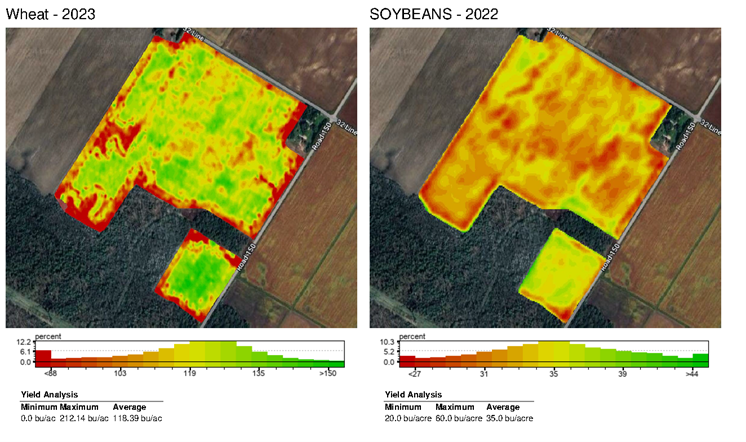
Figure 2: 2023 Wheat and 2022 Soybean Yield Maps for the NW Field
Plant Available Water for NW Field
The Plant Available Water layer shows that the areas of the field that have 70-80% of the normal yield also have lower available water. In this field we can deduce that corn grown in these areas is impacted by drought or lack of water for a significant period during the corn’s life cycle. We know that corn requires lots of water during the critical pollination period immediately after silking[1]. If the soil in a particular area of a field has low plant available water and this is verified by normalized corn yield data, then we can confidently reduce the seeding population in these areas.
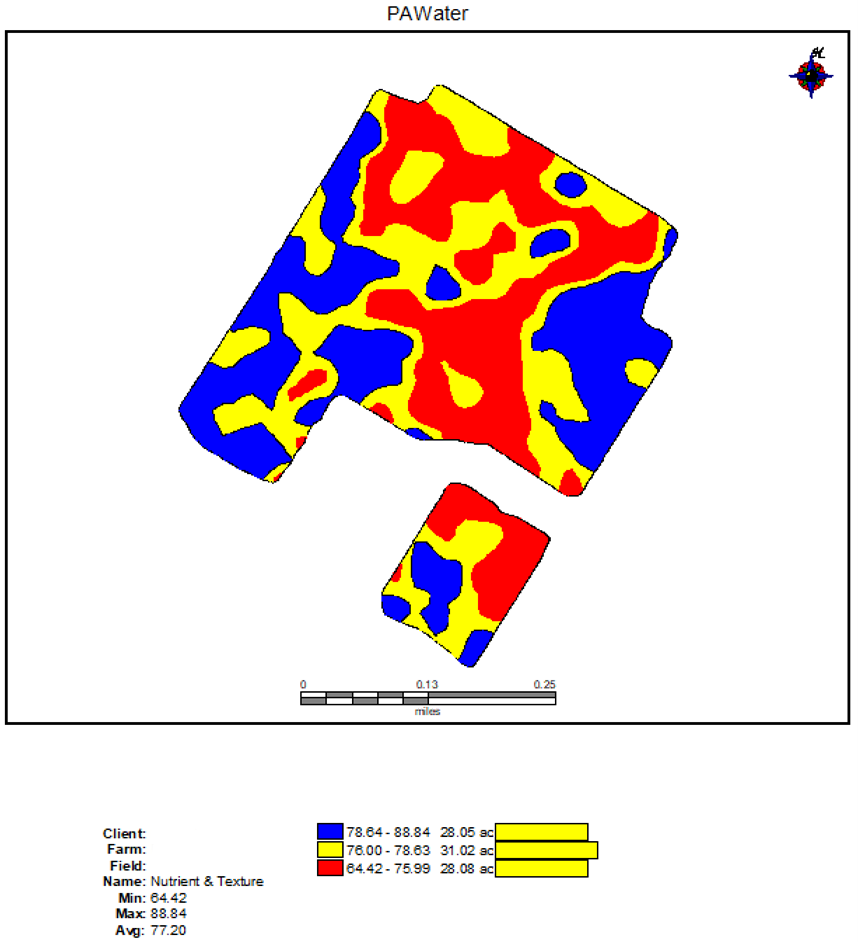
Figure 3: SoilOptix® Plant Available Water layer map
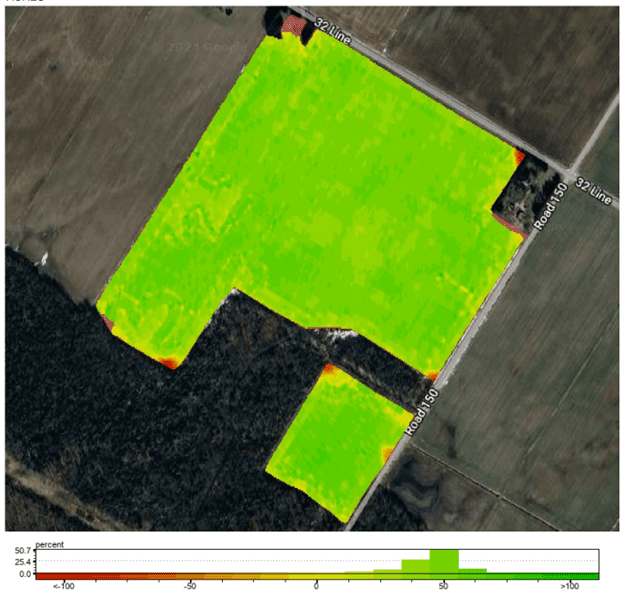
Figure 3.1: Correlation Map between Plant Available Water and 2023 wheat crop
As-Applied Seeding Rate:
Figure 3 is the As-Applied Seeding Rate for the corn crop planted in 2024. The map shows that the areas of the field with the lowest plant available water have been seeded at a plant population of 32,500 – 33,600 seeds per acre (red areas) while the areas of the field with a higher level of plant available water (blue areas) are seeded at rates of 37,600 seeds per acre. Since 31% of the field is planted at a rate of 35,700 seeds per acre, the range extends from 89% to 105%.
The post-harvest analysis can determine if the upper and lower seeding rates for the hybrids used on the field are within an acceptable range for the growing season.
Figure 3.1 highlights the strong correlation (green) between PAW and the 2023 wheat crop, demonstrating the relationship between field PAW variability and wheat yield outcomes. This underscores the effectiveness and accuracy of using PAW as a basis for defining seeding script zones.
Key Learning from NM Field
The key learning from the NW Field is that there are significant seed savings to take advantage of when the Agronomist and farmer agree on the areas of lower yield potential. When 25-30% of the field can be seeded at 10-12% lower rate and 20-25% is seeded at a rate that is only 5% higher than the average rate (a static rate for other fields), the result is a reallocation of the seeding cost for the field. The NW Field shows a net overall reduction in seeding costs. The Plant Available Water layer has served as a tool to facilitate this decision.
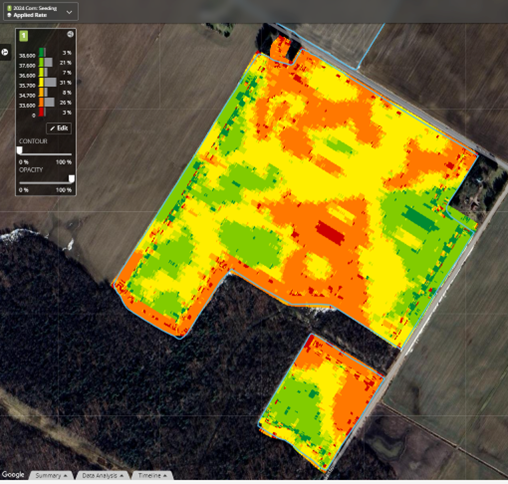
Figure 4: As-Applied Seeding Rate
The Agronomist noted that the areas around the border were manually overwritten due to low historical yield consistently as a result of wildlife interference.
Three Year’s of Corn Yield Data: The SR Field
A second example from the same SW Ontario Agronomist uses three years of high-resolution corn yield data to build the Normalized Yield Map. The crop years of 2015, 2018 and 2021 were used to create the map shown in Figure 4.
All fields are unique, and all crop years are unique so we can see from the three crop years that soil compaction is likely a problem on the north headland – although the 2018 corn yield does not show the extremes that 2015 and 2021 indicate. You will also note that the corn yield in 2018 shows the east headland yielding higher than the area immediately to the west of the headland rows. This may be an indication that the hybrid used to plant the headlands and the west part of the field yielded significantly higher in 2021 than the second hybrid. There are numerous reasons why this result occurred and is proof, once again, that post-harvest analysis with the farmer over a cup of coffee is critical to the implementation of a VRT Seeding program.
Normalized Yield for the SR Field
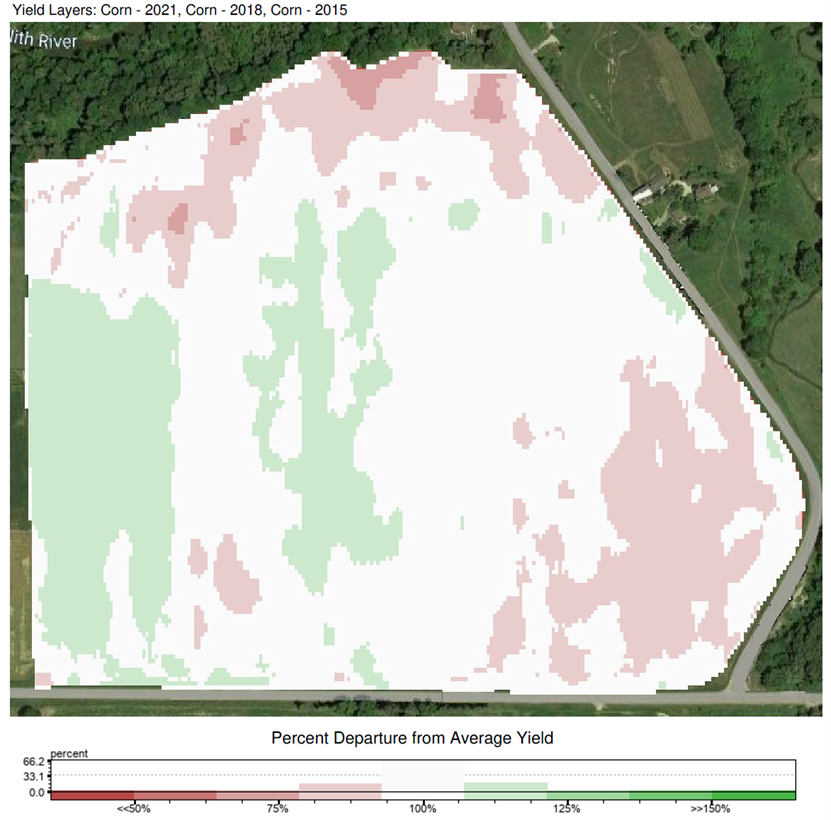
Figure 5: Normalized Yield map for SR Field
Historical Yield Maps for SR Corn Field
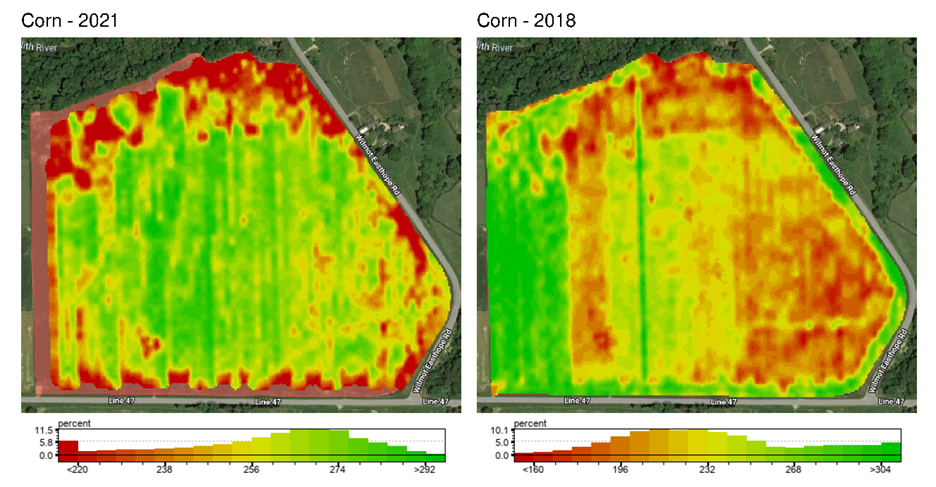
Figure 6: 2021 & 2018 Yield Maps for SR Corn Field
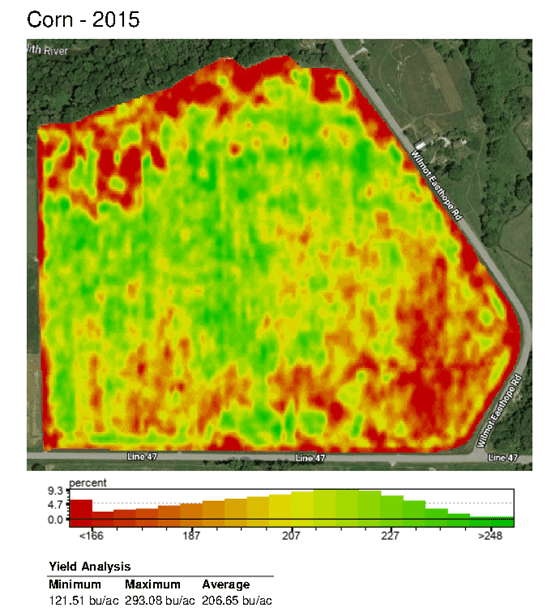
Figure 7: 2015 Yield Map for SR Corn Field
Plant Available Water – SR Field
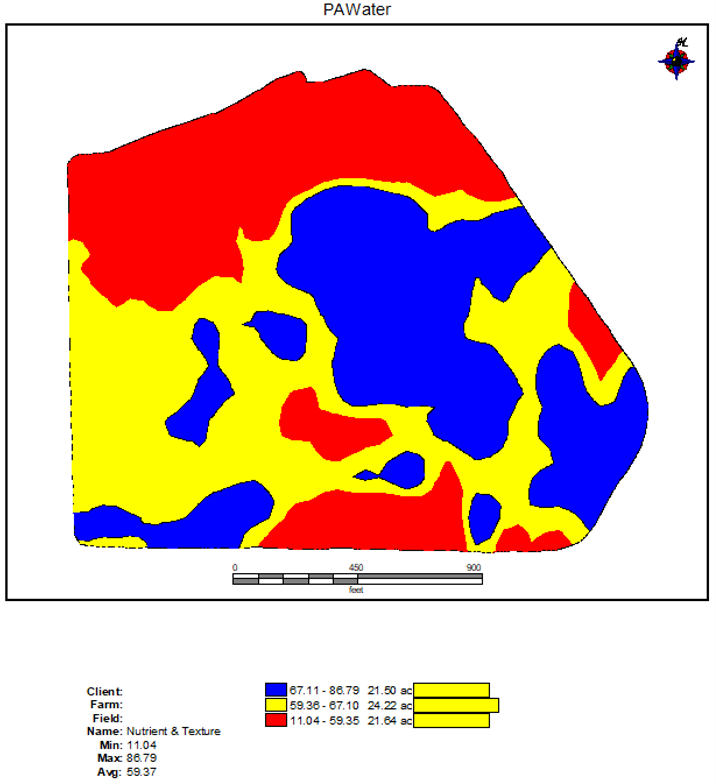
Figure 8: Plant Available Water layer map for SR Field
As-Applied Planting Map for SR Field
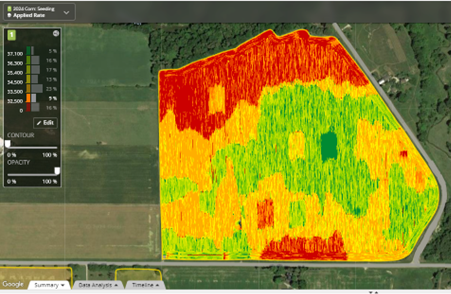
Figure 9: As-Applied Planting Map for SR Field
The Agronomist (and the farmer) have taken a more conservative approach on the SR Field.
The average As-Applied seeding rate is 34,600 seeds per acre (target was 34,300) with a high rate of 36,300 seeds per acre and a low rate of 32,500 seeds per acre. This is a range of 94% to 105% of the average rate.
Thus, the decision was made to seed at +/- 5% of the average seeding rate for the hybrid. This somewhat cautious approach can be used on many fields were the yield extremes demonstrated in the normalized yield map are relatively small.
Conclusion: Did the VRT Script have an Impact on the Profitability of the Corn Crop?
We will need to obtain a 2024 corn yield map for a final analysis of these two fields to accurately answer that question. However, the Agronomist has taken a brave step to utilize a SoilOptix® layer, such as Plant Available Water, in a series of conversations with the farmer to overcome the frustration of seeding a field with obvious variability to a static rate that under-seeds the high yielding areas and overseeds the problem areas of the field that show lower than average yield potential.
We now have a logical process developing VRT seeding scripts using normalized yield and a high resolution SoilOptix® Layer, such as Plant Available Water, to lower seeding costs on the field. This alone is a “win” for the farmer.
The corresponding yield increases in the high yield areas will drive overall profitability of the field.
The logical next step is to determine in-season if we can reduce the rates of other crop inputs to further decrease the cost of inputs in the lower yielding areas and therefore drive further increases in the profitability of the field. However, this process requires significant crop scouting, weather monitoring and discussions with the farmer in real-time to prevent crop pests such as weeds or disease from having a detrimental effect on harvestable yield.
See Part 2 of this Case Study, where we follow up after Harvest 2024 and review the crop yield and performance of the Variable Rate Seeding script. The follow up article can be found here: VR Seeding Using Plant Available Water Part 2.
Footnotes
[1] https://extensionpubs.unl.edu/publication/g1850/na/html/view
About The Author
Steve Redmond; BSc
Steve Redmond has 35+ years of agricultural experience including crop protection roles in R&D and technical support, seed sales, environmental/nutrient management, soil sampling and fertility recommendations. His experience with Wintex soil samplers, an Aeryon Scout drone, GreenSeeker/Y-Drop applicators and NDVI imagery, VRT seeding and fungicide applications prepared him to enthusiastically embrace the SoilOptix® sensor technology. Now semi-retired, Steve continues to work on projects of interest including “SoilOptix® Agronomy”, balanced nutrition for culinary farms and Irish history.
Connect with Steve: